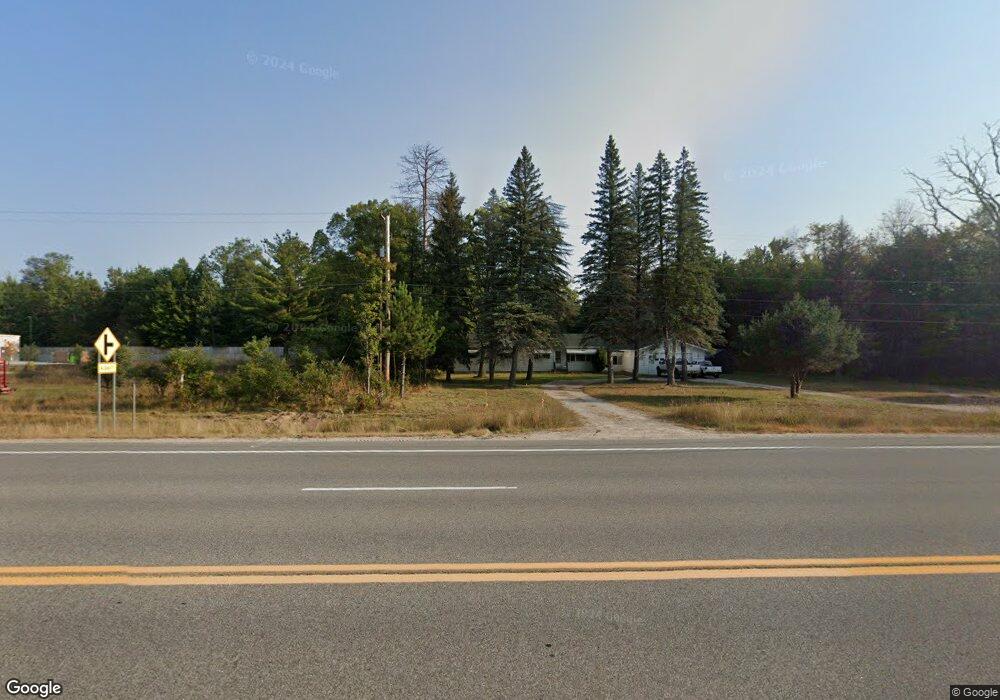
6930 W M 72 Hwy Grayling, MI 49738
Estimated Value: $258,000 - $310,000
3
Beds
1
Bath
1,450
Sq Ft
$199/Sq Ft
Est. Value
About This Home
This home is located at 6930 W M 72 Hwy, Grayling, MI 49738 and is currently estimated at $288,508, approximately $198 per square foot. 6930 W M 72 Hwy is a home located in Crawford County with nearby schools including Grayling Elementary School, Grayling Middle School, and Grayling High School.
Ownership History
Date
Name
Owned For
Owner Type
Purchase Details
Closed on
Mar 29, 2022
Sold by
Bloomquist Terrence H
Bought by
Tompkins Todd
Current Estimated Value
Home Financials for this Owner
Home Financials are based on the most recent Mortgage that was taken out on this home.
Original Mortgage
$197,600
Outstanding Balance
$184,891
Interest Rate
3.89%
Mortgage Type
VA
Estimated Equity
$103,617
Purchase Details
Closed on
Oct 14, 2005
Sold by
Chwastek Zane E and Chwastek Martha L
Bought by
Bloomquist Terrence H and Bloomquist Charlotte
Purchase Details
Closed on
Sep 12, 2005
Sold by
Barber Rebecca and Barber Brian
Bought by
Chwastek Zane and Chwastek Lynn
Purchase Details
Closed on
Jan 24, 2005
Sold by
Chwastek Zane and Chwastek Martha
Bought by
Barber Rebecca and Barber Brian,
Purchase Details
Closed on
Nov 20, 2000
Sold by
Ridley Robert J Sr Dec'D
Bought by
Chwastek Zane and Wf Martha
Purchase Details
Closed on
Sep 20, 2000
Sold by
Ridley Robert
Bought by
Chwastek Zane and Chwastek Martha
Create a Home Valuation Report for This Property
The Home Valuation Report is an in-depth analysis detailing your home's value as well as a comparison with similar homes in the area
Home Values in the Area
Average Home Value in this Area
Purchase History
| Date | Buyer | Sale Price | Title Company |
|---|---|---|---|
| Tompkins Todd | $159,000 | -- | |
| Bloomquist Terrence H | $88,600 | -- | |
| Chwastek Zane | -- | -- | |
| Barber Rebecca | $175,000 | -- | |
| Chwastek Zane | $62,000 | -- | |
| Chwastek Zane | $62,000 | -- |
Source: Public Records
Mortgage History
| Date | Status | Borrower | Loan Amount |
|---|---|---|---|
| Open | Tompkins Todd | $197,600 |
Source: Public Records
Tax History Compared to Growth
Tax History
| Year | Tax Paid | Tax Assessment Tax Assessment Total Assessment is a certain percentage of the fair market value that is determined by local assessors to be the total taxable value of land and additions on the property. | Land | Improvement |
|---|---|---|---|---|
| 2025 | $2,653 | $113,900 | $3,300 | $110,600 |
| 2024 | $1,635 | $102,700 | $3,300 | $99,400 |
| 2023 | $1,563 | $92,000 | $3,300 | $88,700 |
| 2022 | $2,061 | $58,800 | $3,300 | $55,500 |
| 2021 | $1,787 | $57,600 | $3,300 | $54,300 |
| 2020 | $1,764 | $55,700 | $3,300 | $52,400 |
| 2019 | $1,726 | $56,000 | $3,300 | $52,700 |
| 2018 | $1,694 | $48,300 | $3,300 | $45,000 |
| 2017 | $1,365 | $39,900 | $3,300 | $36,600 |
| 2016 | $1,353 | $36,400 | $36,400 | $0 |
| 2015 | $1,644 | $36,400 | $0 | $0 |
| 2014 | -- | $48,000 | $0 | $0 |
| 2013 | -- | $50,300 | $0 | $0 |
Source: Public Records
Map
Nearby Homes
- 1725 S Ausable Trail
- V/L Lot 12 Norseman Dr
- V/L Lot 10 Norseman Dr
- V/L Lot 9 Norseman Dr
- V/L Lot 2 Norseman Dr
- V/L Lot 1 Norseman Dr
- Lot 30 Norseman Dr
- 6375 Hanner Trail
- 6324 W Pine Point Rd
- 6364 Atkinson Rd
- 6960 Trem Pal Rd
- 935 Robinhood Ln
- LOTS 71-75 Evergreen Dr
- 000 W M-72 Hwy
- 268 Yorke Trail
- 601 Peninsular Ave
- 1024 S I-75 Business Loop
- 8063 Collen Ave
- 610 Spruce St
- 701 Chestnut St
- 6930 W M-72 Hwy
- 6264 W M-72 Hwy
- 1777 S Ausable Trail
- 0 W M72 Hwy Unit 78080022816
- 0 W M72 Hwy Unit 2.72 ACRES 201811729
- 6870 W M 72 Hwy
- 6870 W M-72 Hwy
- 6840 W M-72 Hwy
- 6941 W M-72 Hwy
- 6941 W M 72 Hwy
- 6895 W M-72 Hwy
- 6895 W M 72 Hwy
- 6895 W M 72 Hwy Unit 2.53 ACRES
- 6987 W M 72 Hwy
- 6766 W M 72 Hwy
- 1754 Ole Dam Rd
- 1679 S Ausable Trail
- 6736 W M 72 Hwy
- 6838 Michigan 93
- 6405 W M-72 Hwy