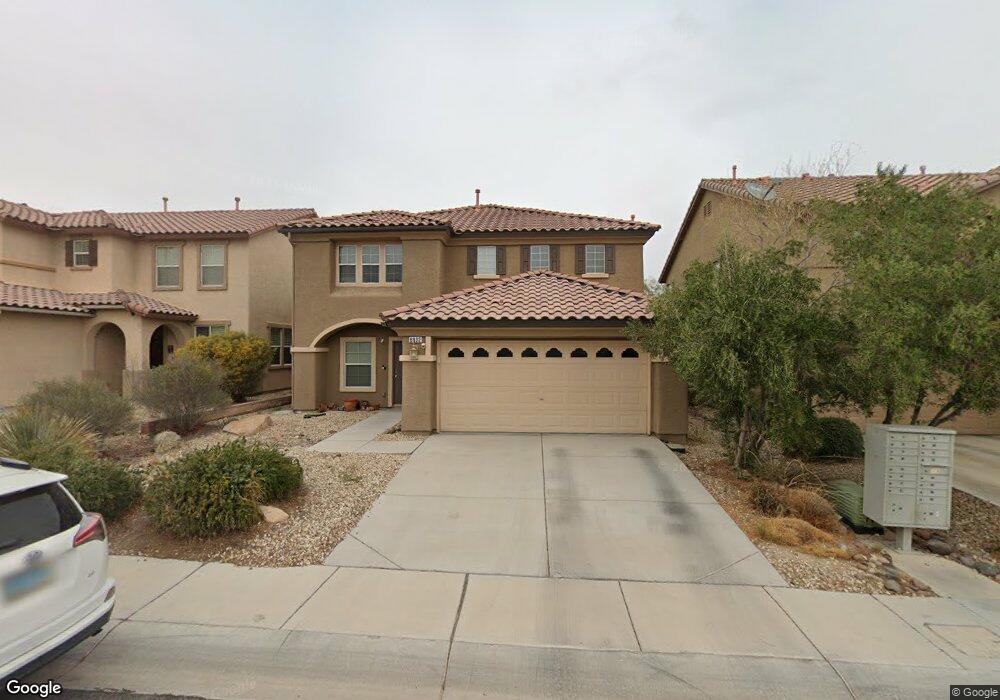
6932 Grand Junction Ave Unit na Las Vegas, NV 89179
Mountains Edge Neighborhood
4
Beds
3
Baths
2,505
Sq Ft
4,792
Sq Ft Lot
About This Home
This home is located at 6932 Grand Junction Ave Unit na, Las Vegas, NV 89179. 6932 Grand Junction Ave Unit na is a home located in Clark County with nearby schools including Desert Oasis High School, Doral Academy West Pebble, and Doral Academy Cactus.
Ownership History
Date
Name
Owned For
Owner Type
Purchase Details
Closed on
Mar 14, 2016
Sold by
Krueger Linda M
Bought by
Nguyen Thai
Home Financials for this Owner
Home Financials are based on the most recent Mortgage that was taken out on this home.
Original Mortgage
$223,850
Outstanding Balance
$177,506
Interest Rate
3.87%
Mortgage Type
FHA
Purchase Details
Closed on
Jan 4, 2016
Sold by
Brown Kathryn L
Bought by
Krueger Linda M and Krueger Family Trust
Purchase Details
Closed on
Nov 25, 2015
Sold by
Evans Byron Richard and Evans Larissa Michelle
Bought by
Evans Larissa Michelle and Errichetto Larissa Michelle
Purchase Details
Closed on
Nov 14, 2005
Sold by
Kb Home Nevada Inc
Bought by
Brown Kathryn Lynn and Errichetto Larissa Michelle
Home Financials for this Owner
Home Financials are based on the most recent Mortgage that was taken out on this home.
Original Mortgage
$279,123
Interest Rate
5.87%
Mortgage Type
Unknown
Create a Home Valuation Report for This Property
The Home Valuation Report is an in-depth analysis detailing your home's value as well as a comparison with similar homes in the area
Home Values in the Area
Average Home Value in this Area
Purchase History
| Date | Buyer | Sale Price | Title Company |
|---|---|---|---|
| Nguyen Thai | $275,000 | Chicago Title Las Vegas | |
| Krueger Linda M | -- | None Available | |
| Evans Larissa Michelle | -- | None Available | |
| Brown Kathryn L | -- | None Available | |
| Brown Kathryn Lynn | $348,904 | First Amer Title Co Of Nv |
Source: Public Records
Mortgage History
| Date | Status | Borrower | Loan Amount |
|---|---|---|---|
| Open | Nguyen Thai | $223,850 | |
| Previous Owner | Brown Kathryn Lynn | $279,123 |
Source: Public Records
Tax History Compared to Growth
Tax History
| Year | Tax Paid | Tax Assessment Tax Assessment Total Assessment is a certain percentage of the fair market value that is determined by local assessors to be the total taxable value of land and additions on the property. | Land | Improvement |
|---|---|---|---|---|
| 2025 | $2,604 | $142,472 | $40,250 | $102,222 |
| 2024 | $2,412 | $142,472 | $40,250 | $102,222 |
| 2023 | $2,412 | $138,238 | $42,000 | $96,238 |
| 2022 | $2,233 | $119,137 | $31,500 | $87,637 |
| 2021 | $2,068 | $111,339 | $28,000 | $83,339 |
| 2020 | $1,918 | $110,422 | $28,000 | $82,422 |
| 2019 | $1,797 | $104,308 | $23,450 | $80,858 |
| 2018 | $1,715 | $97,342 | $19,950 | $77,392 |
| 2017 | $2,676 | $91,227 | $19,950 | $71,277 |
| 2016 | $1,606 | $79,043 | $15,050 | $63,993 |
| 2015 | $1,602 | $75,699 | $11,200 | $64,499 |
| 2014 | $1,555 | $51,449 | $6,300 | $45,149 |
Source: Public Records
Map
Nearby Homes
- 7012 Grand Junction Ave
- 6994 Geronimo Springs Ave
- 11173 Hickory Glen St
- 11083 Camden Bay St
- 7063 Bering Strait Ave
- 7115 Hickory Post Ave
- 7057 Fort Union Ct
- 10925 Prudhoe Bay St
- 7125 Neches Ave
- 7182 Hood River Ave
- 7104 Flathead River Ave
- 7055 Fort Tule Ave
- 7134 Mountain Den Ave
- 7125 Mountain Den Ave
- 7286 Caballo Range Ave
- 7171 Sunny Countryside Ave
- 10730 Lightning Sky St
- 0 W Erie Ave
- 7397 Cobbhan Dr
- 7101 Placid Lake Ave
- 6932 Grand Junction Ave Unit none
- 6932 Grand Junction Ave
- 6922 Grand Junction Ave
- 6952 Grand Junction Ave
- 6912 Grand Junction Ave
- 6927 Bering Strait Ave
- 6935 Bering Strait Ave
- 6919 Bering Strait Ave Unit Lot 51
- 6919 Bering Strait Ave
- 6943 Bering Strait Ave
- 6962 Grand Junction Ave
- 6911 Bering Strait Ave Unit LOT 50
- 6911 Bering Strait Ave
- 6933 Grand Junction Ave
- 6951 Bering Strait Ave Unit Lot 55
- 6951 Bering Strait Ave
- 6943 Grand Junction Ave
- 6902 Grand Junction Ave Unit n/a
- 6902 Grand Junction Ave Unit none
- 6902 Grand Junction Ave