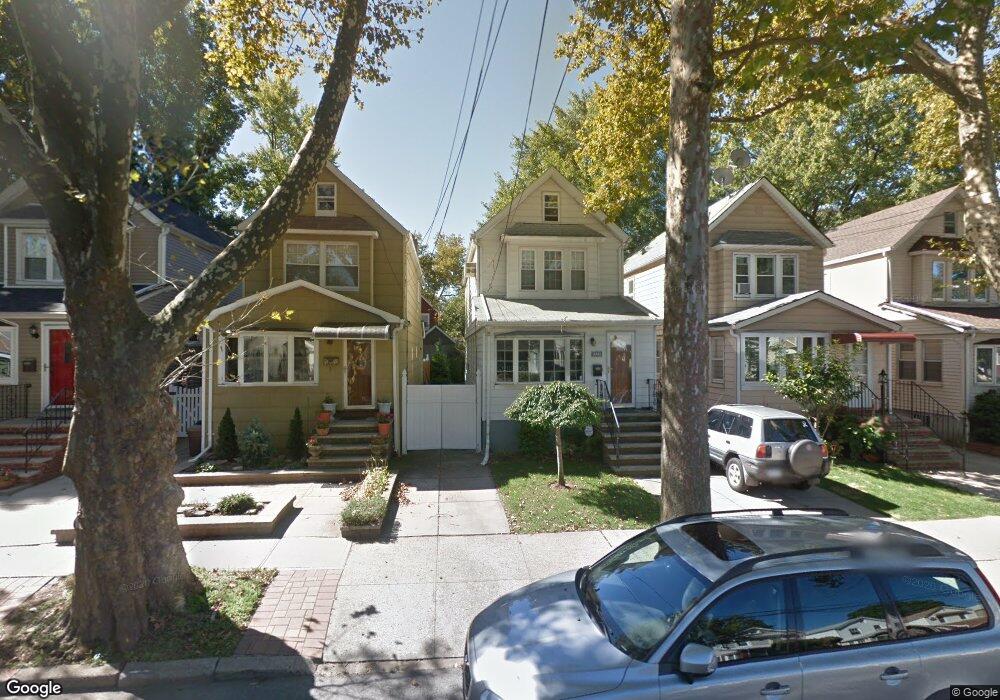
6932 Nansen St Forest Hills, NY 11375
Forest Hills NeighborhoodEstimated Value: $1,004,717 - $1,181,000
--
Bed
--
Bath
1,296
Sq Ft
$828/Sq Ft
Est. Value
About This Home
This home is located at 6932 Nansen St, Forest Hills, NY 11375 and is currently estimated at $1,072,929, approximately $827 per square foot. 6932 Nansen St is a home located in Queens County with nearby schools including Ps 144 Col Jeromus Remsen, J.H.S. 190 Russell Sage, and Queens Metropolitan High School.
Ownership History
Date
Name
Owned For
Owner Type
Purchase Details
Closed on
Feb 15, 2019
Sold by
Hilario Shelina V and San Diego Soledad
Bought by
Hilario Shelina V and Hilario Soledad V
Current Estimated Value
Home Financials for this Owner
Home Financials are based on the most recent Mortgage that was taken out on this home.
Original Mortgage
$52,289
Outstanding Balance
$45,690
Interest Rate
4.4%
Mortgage Type
New Conventional
Estimated Equity
$1,027,239
Purchase Details
Closed on
Aug 29, 2006
Sold by
William E Burn Rev Living Tr U/A Dated
Bought by
Magsisi Welecia
Home Financials for this Owner
Home Financials are based on the most recent Mortgage that was taken out on this home.
Original Mortgage
$360,000
Interest Rate
6.71%
Mortgage Type
Purchase Money Mortgage
Purchase Details
Closed on
Sep 2, 1999
Sold by
Burn William Edwin
Bought by
Burn William E and Shoebridge Doris
Create a Home Valuation Report for This Property
The Home Valuation Report is an in-depth analysis detailing your home's value as well as a comparison with similar homes in the area
Home Values in the Area
Average Home Value in this Area
Purchase History
| Date | Buyer | Sale Price | Title Company |
|---|---|---|---|
| Hilario Shelina V | -- | -- | |
| Hilario Shelina V | -- | -- | |
| Hilario Shelina V | -- | -- | |
| Magsisi Welecia | $450,000 | -- | |
| Magsisi Welecia | $450,000 | -- | |
| Burn William E | -- | First American Title Ins Co | |
| Burn William E | -- | First American Title Ins Co |
Source: Public Records
Mortgage History
| Date | Status | Borrower | Loan Amount |
|---|---|---|---|
| Open | Hilario Shelina V | $52,289 | |
| Closed | Hilario Shelina V | $52,289 | |
| Previous Owner | Magsisi Welecia | $360,000 |
Source: Public Records
Tax History Compared to Growth
Tax History
| Year | Tax Paid | Tax Assessment Tax Assessment Total Assessment is a certain percentage of the fair market value that is determined by local assessors to be the total taxable value of land and additions on the property. | Land | Improvement |
|---|---|---|---|---|
| 2025 | $7,685 | $39,196 | $8,146 | $31,050 |
| 2024 | $7,685 | $38,263 | $8,374 | $29,889 |
| 2023 | $7,254 | $36,116 | $8,303 | $27,813 |
| 2022 | $6,866 | $57,420 | $13,380 | $44,040 |
| 2021 | $6,876 | $60,240 | $13,380 | $46,860 |
| 2020 | $6,914 | $57,300 | $13,380 | $43,920 |
| 2019 | $5,056 | $58,680 | $13,380 | $45,300 |
| 2018 | $6,135 | $30,097 | $7,541 | $22,556 |
| 2017 | $5,843 | $28,663 | $7,573 | $21,090 |
| 2016 | $5,443 | $28,663 | $7,573 | $21,090 |
| 2015 | $3,261 | $27,219 | $10,243 | $16,976 |
| 2014 | $3,261 | $26,572 | $11,075 | $15,497 |
Source: Public Records
Map
Nearby Homes
- 70-15 Nansen St
- 70-19 Manse St
- 6915 Loubet St
- 100-33 Metropolitan Ave
- 70-43 Nansen St
- 68-15 Selfridge Stre 68-15 Selfridge St Unit 5G
- 68-15 Selfridge St Unit 6A
- 68-15 Selfridge St Unit 3J
- 68-15 Selfridge St Unit 1J
- 68-15 Selfridge St Unit 5D
- 68-20 Selfridge St Unit 6J
- 68-20 Selfridge St Unit 4K
- 68-20 Selfridge St Unit 6H
- 6828 Kessel St
- 68-37 Kessel St
- 90-01 68th Ave
- 90-15 70th Dr
- 91-35 71st Ave
- 68-48 Juno St Unit Whole Building
- 91-48 71st Ave
- 6934 Nansen St
- 6930 Nansen St
- 6936 Nansen St
- 6926 Nansen St
- 69-26 Nansen St
- 6940 Nansen St
- 6924 Nansen St
- 6942 Nansen St
- 6922 Nansen St
- 6929 Olcott St
- 69-22 Nansen St
- 6933 Olcott St
- 6927 Olcott St
- 6935 Olcott St
- 6925 Olcott St
- 6937 Olcott St
- 6944 Nansen St
- 6920 Nansen St
- 6935 Olcott St
- 69-35 Olcott St