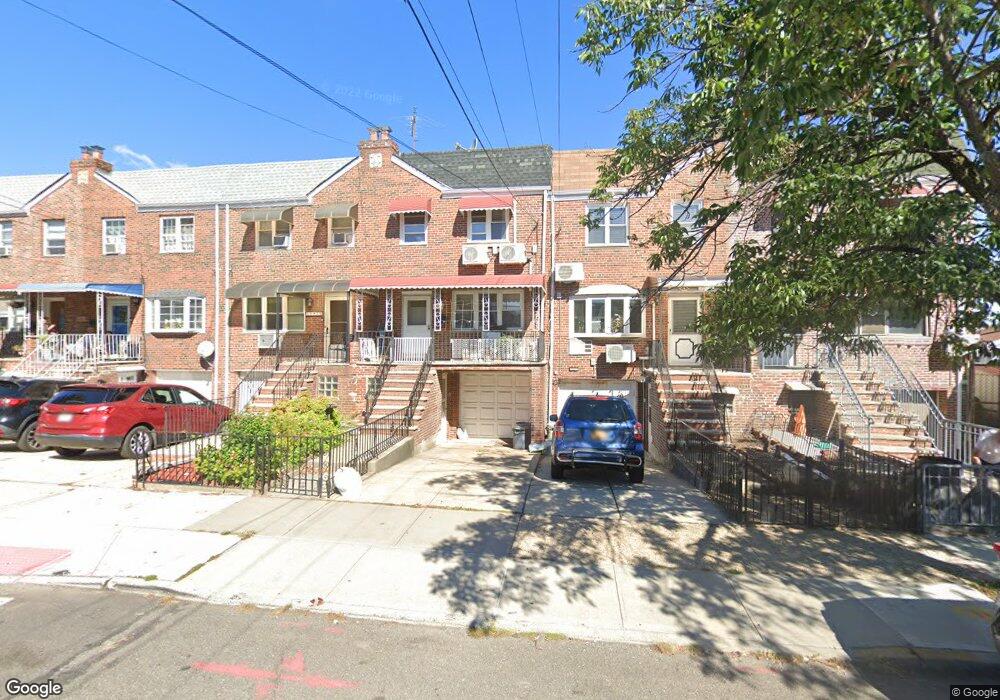
6933 54th Ave Maspeth, NY 11378
Maspeth NeighborhoodEstimated Value: $809,216 - $1,005,000
Studio
--
Bath
1,732
Sq Ft
$539/Sq Ft
Est. Value
About This Home
This home is located at 6933 54th Ave, Maspeth, NY 11378 and is currently estimated at $934,054, approximately $539 per square foot. 6933 54th Ave is a home located in Queens County with nearby schools including Ps 58 School Of Heroes, IS 73 - The Frank Sansivieri School, and Grover Cleveland High School.
Ownership History
Date
Name
Owned For
Owner Type
Purchase Details
Closed on
Jan 11, 2017
Sold by
Daprocida Carol Ann and Daprocida Jean L
Bought by
Cai Mona Meng and Chen Guang
Current Estimated Value
Purchase Details
Closed on
Aug 18, 2010
Sold by
Edmund Folusiak Asset Mgmt Trust Dated
Bought by
Cai Mona Meng
Purchase Details
Closed on
Jan 29, 2009
Sold by
Folusiak Edmund
Bought by
Edmund Folusiak Asset Management Trust
Create a Home Valuation Report for This Property
The Home Valuation Report is an in-depth analysis detailing your home's value as well as a comparison with similar homes in the area
Home Values in the Area
Average Home Value in this Area
Purchase History
| Date | Buyer | Sale Price | Title Company |
|---|---|---|---|
| Cai Mona Meng | $245,000 | -- | |
| Cai Mona Meng | $245,000 | -- | |
| Cai Mona Meng | $450,000 | -- | |
| Cai Mona Meng | $450,000 | -- | |
| Edmund Folusiak Asset Management Trust | -- | -- | |
| Edmund Folusiak Asset Management Trust | -- | -- |
Source: Public Records
Tax History
| Year | Tax Paid | Tax Assessment Tax Assessment Total Assessment is a certain percentage of the fair market value that is determined by local assessors to be the total taxable value of land and additions on the property. | Land | Improvement |
|---|---|---|---|---|
| 2025 | $3,111 | $40,846 | $6,031 | $34,815 |
| 2024 | $3,215 | $38,574 | $5,928 | $32,646 |
| 2023 | $6,751 | $37,411 | $5,039 | $32,372 |
| 2022 | $2,759 | $52,440 | $7,920 | $44,520 |
| 2021 | $2,923 | $49,380 | $7,920 | $41,460 |
| 2020 | $2,943 | $51,540 | $7,920 | $43,620 |
| 2019 | $2,703 | $56,760 | $7,920 | $48,840 |
| 2018 | $2,519 | $31,176 | $5,584 | $25,592 |
| 2017 | $2,418 | $30,066 | $6,172 | $23,894 |
| 2016 | $2,214 | $30,066 | $6,172 | $23,894 |
| 2015 | $1,272 | $28,365 | $7,765 | $20,600 |
| 2014 | $1,272 | $26,788 | $7,923 | $18,865 |
Source: Public Records
Map
Nearby Homes
Your Personal Tour Guide
Ask me questions while you tour the home.