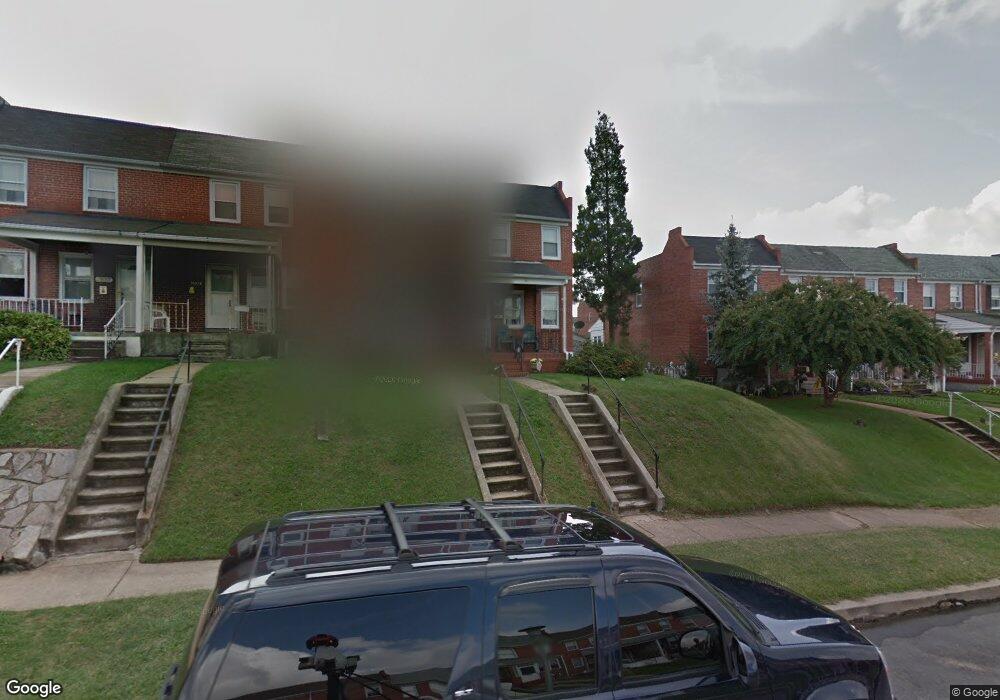
6933 Conley St Baltimore, MD 21224
Estimated Value: $166,194 - $194,000
Studio
1
Bath
896
Sq Ft
$204/Sq Ft
Est. Value
About This Home
This home is located at 6933 Conley St, Baltimore, MD 21224 and is currently estimated at $182,549, approximately $203 per square foot. 6933 Conley St is a home located in Baltimore County with nearby schools including Colgate Elementary, Holabird Middle School, and Dundalk High School.
Ownership History
Date
Name
Owned For
Owner Type
Purchase Details
Closed on
Jun 15, 2006
Sold by
Zuk Thomas J
Bought by
Zuk Thomas J and Zuk Amy B
Current Estimated Value
Purchase Details
Closed on
Jun 2, 2006
Sold by
Zuk Thomas J
Bought by
Zuk Thomas J and Zuk Amy B
Purchase Details
Closed on
Apr 3, 2002
Sold by
Eliadis Emmanuel
Bought by
Zuk Thomas J and Denk Amy B
Purchase Details
Closed on
Sep 23, 1997
Sold by
Eliadis Emmanuel
Bought by
Eliadis Emmanuel and Eliadis Dawn
Purchase Details
Closed on
Jul 24, 1997
Sold by
Ieromonachos Emmanuel G
Bought by
Eliadis Emmanuel and Eliadis Dawn
Create a Home Valuation Report for This Property
The Home Valuation Report is an in-depth analysis detailing your home's value as well as a comparison with similar homes in the area
Purchase History
| Date | Buyer | Sale Price | Title Company |
|---|---|---|---|
| Zuk Thomas J | -- | -- | |
| Zuk Thomas J | -- | -- | |
| Zuk Thomas J | $72,600 | -- | |
| Eliadis Emmanuel | -- | -- | |
| Eliadis Emmanuel | -- | -- |
Source: Public Records
Tax History
| Year | Tax Paid | Tax Assessment Tax Assessment Total Assessment is a certain percentage of the fair market value that is determined by local assessors to be the total taxable value of land and additions on the property. | Land | Improvement |
|---|---|---|---|---|
| 2025 | $2,239 | $139,867 | -- | -- |
| 2024 | $2,239 | $127,933 | $0 | $0 |
| 2023 | $1,055 | $116,000 | $36,000 | $80,000 |
| 2022 | $2,020 | $113,767 | $0 | $0 |
| 2021 | $1,888 | $111,533 | $0 | $0 |
| 2020 | $1,888 | $109,300 | $36,000 | $73,300 |
| 2019 | $1,868 | $108,367 | $0 | $0 |
| 2018 | $1,874 | $107,433 | $0 | $0 |
| 2017 | $1,768 | $106,500 | $0 | $0 |
| 2016 | $1,484 | $106,500 | $0 | $0 |
| 2015 | $1,484 | $106,500 | $0 | $0 |
| 2014 | $1,484 | $110,800 | $0 | $0 |
Source: Public Records
Map
Nearby Homes
Your Personal Tour Guide
Ask me questions while you tour the home.