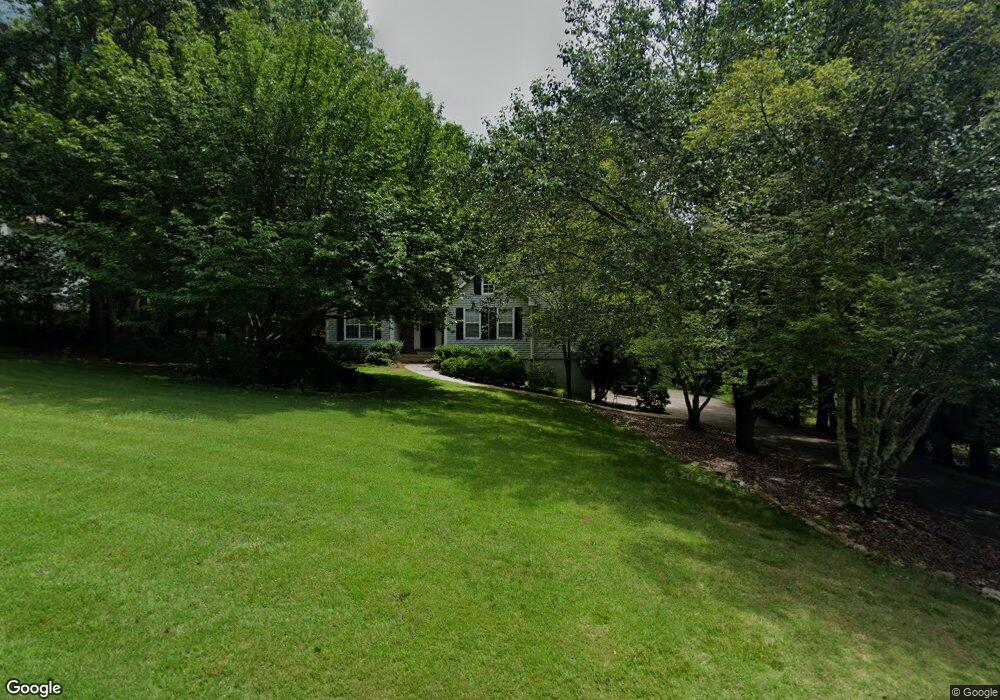
6935 Crossview Dr Cumming, GA 30041
Lake Lanier NeighborhoodEstimated Value: $348,000 - $400,000
3
Beds
2
Baths
1,405
Sq Ft
$271/Sq Ft
Est. Value
About This Home
This home is located at 6935 Crossview Dr, Cumming, GA 30041 and is currently estimated at $381,144, approximately $271 per square foot. 6935 Crossview Dr is a home located in Forsyth County with nearby schools including Chestatee Elementary School, North Forsyth Middle School, and War Hill Christian Academy.
Ownership History
Date
Name
Owned For
Owner Type
Purchase Details
Closed on
Mar 7, 2011
Sold by
Hamilton Jeremy
Bought by
Westbrook John E
Current Estimated Value
Home Financials for this Owner
Home Financials are based on the most recent Mortgage that was taken out on this home.
Original Mortgage
$131,445
Interest Rate
4.85%
Mortgage Type
New Conventional
Purchase Details
Closed on
Jul 19, 2005
Sold by
Hunter Donald E and Hunter Wendy
Bought by
Hamilton Jeremy and Hamilton Alisha
Home Financials for this Owner
Home Financials are based on the most recent Mortgage that was taken out on this home.
Original Mortgage
$156,500
Interest Rate
5.59%
Mortgage Type
New Conventional
Purchase Details
Closed on
Mar 24, 1994
Sold by
John Allgood Inc
Bought by
Hunter Donald Wendy
Home Financials for this Owner
Home Financials are based on the most recent Mortgage that was taken out on this home.
Original Mortgage
$95,150
Interest Rate
7.2%
Create a Home Valuation Report for This Property
The Home Valuation Report is an in-depth analysis detailing your home's value as well as a comparison with similar homes in the area
Home Values in the Area
Average Home Value in this Area
Purchase History
| Date | Buyer | Sale Price | Title Company |
|---|---|---|---|
| Westbrook John E | $127,000 | -- | |
| Hamilton Jeremy | $156,500 | -- | |
| Hunter Donald Wendy | $100,200 | -- |
Source: Public Records
Mortgage History
| Date | Status | Borrower | Loan Amount |
|---|---|---|---|
| Previous Owner | Westbrook John E | $131,445 | |
| Previous Owner | Hamilton Jeremy | $156,500 | |
| Previous Owner | Hunter Donald Wendy | $95,150 |
Source: Public Records
Tax History Compared to Growth
Tax History
| Year | Tax Paid | Tax Assessment Tax Assessment Total Assessment is a certain percentage of the fair market value that is determined by local assessors to be the total taxable value of land and additions on the property. | Land | Improvement |
|---|---|---|---|---|
| 2025 | $3,289 | $133,388 | $46,000 | $87,388 |
| 2024 | $3,289 | $134,120 | $40,000 | $94,120 |
| 2023 | $3,000 | $121,884 | $34,000 | $87,884 |
| 2022 | $2,776 | $90,332 | $20,000 | $70,332 |
| 2021 | $2,494 | $90,332 | $20,000 | $70,332 |
| 2020 | $2,248 | $81,408 | $14,000 | $67,408 |
| 2019 | $2,169 | $78,444 | $14,000 | $64,444 |
| 2018 | $1,729 | $62,520 | $14,000 | $48,520 |
| 2017 | $1,608 | $57,932 | $14,000 | $43,932 |
| 2016 | $1,608 | $57,932 | $14,000 | $43,932 |
| 2015 | $1,611 | $57,932 | $14,000 | $43,932 |
| 2014 | $1,182 | $44,652 | $0 | $0 |
Source: Public Records
Map
Nearby Homes
- 6745 Payton Rd
- 6370 Stillwood Ln
- 5385 Old Haven Ct
- 0 Ga 400 Hwy Unit 10418657
- 6765 Creek View Ln
- 6865 N Creekside Point
- 5925 Whitney Ct
- 5935 Whitney Ct
- 6265 Smoke Ridge Ln
- 5050 Plainsman Cir
- 4960 Plainsman Cir
- 5725 Jot Em Down Rd
- 5250 Kendalls Way
- 5355 Mountain Top Place
- 6515 Mountain Vista Ct
- 6945 W Mountain Crossing
- 4830 Frontier Dr
- 5110 Kongoni Ct
- 6945 Crossview Dr
- 6925 Crossview Dr
- 6915 Crossview Dr
- 6955 Crossview Dr
- 6830 Payton Rd Unit 6830
- 6830 Payton Rd
- 6820 Payton Rd
- 6840 Payton Rd
- 6930 Crossview Dr
- 6940 Crossview Dr
- 6905 Crossview Dr
- 6810 Payton Rd
- 6920 Crossview Dr
- 6950 Crossview Dr
- 0 Crossview Dr Unit 8586703
- 0 Crossview Dr Unit 8445793
- 0 Crossview Dr Unit 7101118
- 0 Crossview Dr Unit 8996366
- 0 Crossview Dr Unit 9027491
- 0 Crossview Dr Unit 8770891