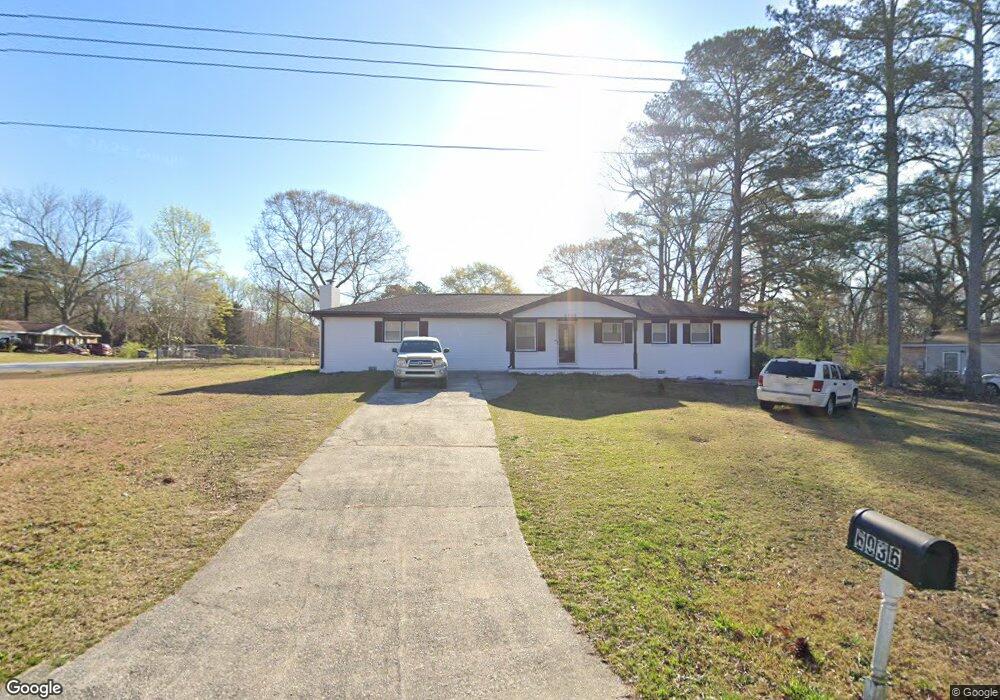
6936 Debbie Ln Unit 66 Lithia Springs, GA 30122
Lithia Springs NeighborhoodEstimated Value: $264,000 - $293,000
3
Beds
2
Baths
1,725
Sq Ft
$162/Sq Ft
Est. Value
About This Home
This home is located at 6936 Debbie Ln Unit 66, Lithia Springs, GA 30122 and is currently estimated at $279,266, approximately $161 per square foot. 6936 Debbie Ln Unit 66 is a home located in Douglas County with nearby schools including Lithia Springs Elementary School, Turner Middle School, and Lithia Springs Comprehensive High School.
Ownership History
Date
Name
Owned For
Owner Type
Purchase Details
Closed on
Dec 13, 2019
Sold by
Rubio Whitman D
Bought by
Salinas Erick Garcia and Valente Eneldy A Sabino
Current Estimated Value
Home Financials for this Owner
Home Financials are based on the most recent Mortgage that was taken out on this home.
Original Mortgage
$120,000
Outstanding Balance
$106,004
Interest Rate
3.7%
Mortgage Type
New Conventional
Estimated Equity
$173,262
Purchase Details
Closed on
Dec 23, 2005
Sold by
Kreh Steven A and Kreh Kim E
Bought by
Rubio Whitman D and Ruiz Fredy
Home Financials for this Owner
Home Financials are based on the most recent Mortgage that was taken out on this home.
Original Mortgage
$119,059
Interest Rate
6.28%
Mortgage Type
FHA
Purchase Details
Closed on
Mar 27, 1995
Sold by
Sparks Richard C
Bought by
Kreh Steven A Kim E
Create a Home Valuation Report for This Property
The Home Valuation Report is an in-depth analysis detailing your home's value as well as a comparison with similar homes in the area
Home Values in the Area
Average Home Value in this Area
Purchase History
| Date | Buyer | Sale Price | Title Company |
|---|---|---|---|
| Salinas Erick Garcia | $160,000 | -- | |
| Rubio Whitman D | $120,000 | -- | |
| Kreh Steven A Kim E | $62,000 | -- |
Source: Public Records
Mortgage History
| Date | Status | Borrower | Loan Amount |
|---|---|---|---|
| Open | Salinas Erick Garcia | $120,000 | |
| Previous Owner | Rubio Whitman D | $119,059 | |
| Closed | Kreh Steven A Kim E | $0 |
Source: Public Records
Tax History Compared to Growth
Tax History
| Year | Tax Paid | Tax Assessment Tax Assessment Total Assessment is a certain percentage of the fair market value that is determined by local assessors to be the total taxable value of land and additions on the property. | Land | Improvement |
|---|---|---|---|---|
| 2024 | $3,440 | $109,320 | $19,600 | $89,720 |
| 2023 | $3,440 | $94,360 | $22,840 | $71,520 |
| 2022 | $1,747 | $65,760 | $15,520 | $50,240 |
| 2021 | $1,397 | $48,160 | $11,520 | $36,640 |
| 2020 | $1,424 | $48,160 | $11,520 | $36,640 |
| 2019 | $1,400 | $50,920 | $9,320 | $41,600 |
| 2018 | $1,231 | $42,800 | $8,120 | $34,680 |
| 2017 | $1,124 | $38,720 | $8,120 | $30,600 |
| 2016 | $1,051 | $35,880 | $7,800 | $28,080 |
| 2015 | $953 | $32,280 | $7,200 | $25,080 |
| 2014 | $971 | $32,240 | $7,600 | $24,640 |
| 2013 | -- | $32,120 | $7,600 | $24,520 |
Source: Public Records
Map
Nearby Homes
- 6807 Tralee Dr
- 4365 Clare Ln
- 6776 Tralee Dr Unit 1
- 7163 Bluebird Ln
- 7144 Carolyn Cir
- 4485 Canary Ct
- 4336 Parkview Dr
- 4319 Parkview Dr
- 540 Boulder Park Dr
- 11041 Veterans Memorial Hwy
- 7146 Old Beulah Rd
- 0 Mckown Rd Unit 7632191
- 0 Mckown Rd Unit 10583796
- 3916 S Martin Way
- 4361 Ben Hill Rd
- 6906 Cherry Cir
- 11411 Veterans Memorial Hwy
- 6936 Debbie Ln
- 6948 Debbie Ln
- 6935 Shannon Dr Unit 96
- 6935 Shannon Dr Unit 1
- 4557 Clare Ln
- 6949 Shannon Dr Unit 1
- 6960 Debbie Ln
- 4571 Clare Ln
- 4543 Clare Ln
- 6939 Debbie Ln
- 6951 Debbie Ln
- 6972 Debbie Ln
- 6965 Shannon Dr
- 4585 Clare Ln
- 4529 Clare Ln
- 6963 Debbie Ln
- 4514 Clare Ln
- 6982 Debbie Ln
- 6982 Debbie Ln Unit 70
- 4597 Clare Ln