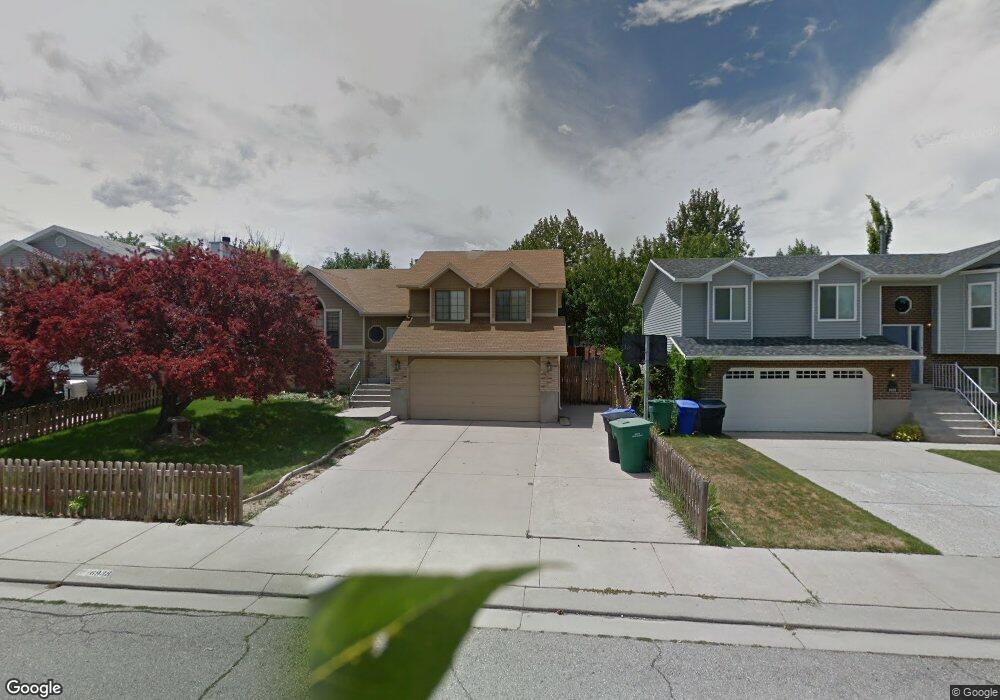
6938 Foxflower Ct West Jordan, UT 84081
Oquirrh NeighborhoodEstimated Value: $450,000 - $515,000
4
Beds
2
Baths
1,586
Sq Ft
$307/Sq Ft
Est. Value
About This Home
This home is located at 6938 Foxflower Ct, West Jordan, UT 84081 and is currently estimated at $486,686, approximately $306 per square foot. 6938 Foxflower Ct is a home located in Salt Lake County with nearby schools including Mountain Shadows School, West Hills Middle School, and Copper Hills High School.
Ownership History
Date
Name
Owned For
Owner Type
Purchase Details
Closed on
May 28, 2013
Sold by
Alexander James Lee and Alexander Jacquleen
Bought by
Groo Brian
Current Estimated Value
Home Financials for this Owner
Home Financials are based on the most recent Mortgage that was taken out on this home.
Original Mortgage
$169,000
Outstanding Balance
$119,626
Interest Rate
3.38%
Mortgage Type
New Conventional
Estimated Equity
$367,060
Purchase Details
Closed on
Sep 28, 2009
Sold by
Alexander James Lee
Bought by
Alexander James Lee and Alexander Jacqueleen
Purchase Details
Closed on
Jun 7, 2008
Sold by
Frazier Peggy Anne
Bought by
Alexander James Lee
Home Financials for this Owner
Home Financials are based on the most recent Mortgage that was taken out on this home.
Original Mortgage
$202,144
Interest Rate
6.05%
Mortgage Type
FHA
Purchase Details
Closed on
Feb 28, 2007
Sold by
Roberts Sandra and Roberts Johnny
Bought by
Frazier Peggy Anne
Home Financials for this Owner
Home Financials are based on the most recent Mortgage that was taken out on this home.
Original Mortgage
$236,500
Interest Rate
8.75%
Mortgage Type
Balloon
Purchase Details
Closed on
Jun 24, 2003
Sold by
Feller P Jack and Feller Margot M
Bought by
Roberts Johnny and Roberts Sandra
Home Financials for this Owner
Home Financials are based on the most recent Mortgage that was taken out on this home.
Original Mortgage
$139,510
Interest Rate
5.37%
Mortgage Type
FHA
Purchase Details
Closed on
Dec 29, 2000
Sold by
Cassity Ryan R and Cassity Teffany M
Bought by
Feller P Jack and Feller Margot M
Home Financials for this Owner
Home Financials are based on the most recent Mortgage that was taken out on this home.
Original Mortgage
$132,050
Interest Rate
7.71%
Purchase Details
Closed on
Mar 23, 2000
Sold by
Tucker Bryan D and Tucker Wendy B
Bought by
Cassity Ryan R and Cassity Tiffany M
Home Financials for this Owner
Home Financials are based on the most recent Mortgage that was taken out on this home.
Original Mortgage
$100,001
Interest Rate
8.34%
Purchase Details
Closed on
Sep 12, 1996
Sold by
Sommer Bob and Sommer Michelle
Bought by
Tucker Bryan D and Tucker Wendy B
Home Financials for this Owner
Home Financials are based on the most recent Mortgage that was taken out on this home.
Original Mortgage
$123,966
Interest Rate
8.23%
Mortgage Type
FHA
Create a Home Valuation Report for This Property
The Home Valuation Report is an in-depth analysis detailing your home's value as well as a comparison with similar homes in the area
Home Values in the Area
Average Home Value in this Area
Purchase History
| Date | Buyer | Sale Price | Title Company |
|---|---|---|---|
| Groo Brian | -- | Monument Title Ins Co | |
| Alexander James Lee | -- | Beehive Title Ins Agcy Lc | |
| Alexander James Lee | -- | Integrated Title Ins Svcs | |
| Frazier Peggy Anne | -- | Bonneville Superior Title | |
| Roberts Johnny | -- | First American Title | |
| Feller P Jack | -- | Superior Title | |
| Cassity Ryan R | -- | Superior Title Company | |
| Tucker Bryan D | -- | Superior Title Company |
Source: Public Records
Mortgage History
| Date | Status | Borrower | Loan Amount |
|---|---|---|---|
| Open | Groo Brian | $169,000 | |
| Previous Owner | Alexander James Lee | $202,144 | |
| Previous Owner | Frazier Peggy Anne | $236,500 | |
| Previous Owner | Roberts Johnny | $139,510 | |
| Previous Owner | Feller P Jack | $132,050 | |
| Previous Owner | Cassity Ryan R | $100,001 | |
| Previous Owner | Tucker Bryan D | $123,966 |
Source: Public Records
Tax History Compared to Growth
Tax History
| Year | Tax Paid | Tax Assessment Tax Assessment Total Assessment is a certain percentage of the fair market value that is determined by local assessors to be the total taxable value of land and additions on the property. | Land | Improvement |
|---|---|---|---|---|
| 2025 | $2,640 | $472,700 | $121,000 | $351,700 |
| 2024 | $2,640 | $446,300 | $114,100 | $332,200 |
| 2023 | $2,637 | $418,800 | $109,700 | $309,100 |
| 2022 | $2,678 | $422,700 | $107,600 | $315,100 |
| 2021 | $2,352 | $344,700 | $82,700 | $262,000 |
| 2020 | $2,192 | $300,000 | $82,700 | $217,300 |
| 2019 | $2,138 | $286,200 | $78,100 | $208,100 |
| 2018 | $1,983 | $262,000 | $78,100 | $183,900 |
| 2017 | $1,753 | $228,200 | $78,100 | $150,100 |
| 2016 | $1,689 | $206,800 | $78,100 | $128,700 |
| 2015 | $1,604 | $189,500 | $74,800 | $114,700 |
| 2014 | $1,572 | $182,500 | $72,400 | $110,100 |
Source: Public Records
Map
Nearby Homes
- 7043 S Orion Hill Rd
- 7043 Orion Hill Rd
- 6928 Beargrass Rd
- 6839 S Cyclamen Dr
- 7232 W Terraine Rd
- 7238 W Terraine Rd
- 7246 W Terraine Rd
- 6853 Mullien Dr Unit 5420
- 7758 S Iron Core Ln
- 7146 W Owens View Way Unit 204
- 7259 W Cibola Rd
- 5208 W Case Mountain Rd
- 5281 Saguaro Dr
- 6922 Mullien Dr
- 5466 Ticklegrass Rd
- 5151 Case Mountain Rd
- 5183 W Cadenza Dr
- 6706 Marshrock Rd
- 4983 Shooting Star Ave
- 5579 W Lopalena Cir
- 6938 S Foxflower Ct
- 6948 Foxflower Ct
- 6928 S Foxflower Ct
- 6928 Foxflower Ct
- 6958 Foxflower Ct
- 6941 Firefox Cir
- 6931 Firefox Cir
- 6931 S Firefox Cir
- 6951 S Firefox Cir
- 6951 Firefox Cir
- 6935 S Foxflower Ct
- 6935 Foxflower Ct
- 6957 S Firefox Cir
- 6945 S Foxflower Ct
- 6945 Foxflower Ct
- 6927 S Foxflower Ct
- 6927 Foxflower Ct
- 6957 Firefox Cir
- 5264 Ticklegrass Rd
- 5256 W Ticklegrass Rd