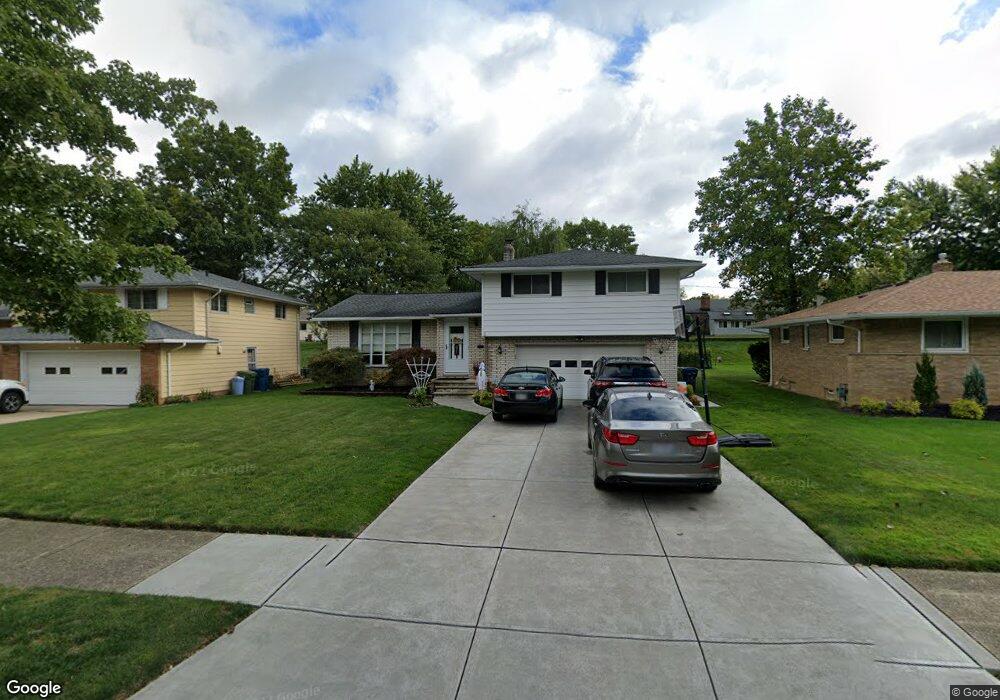
6939 Greenbriar Dr Parma Heights, OH 44130
Estimated Value: $237,243 - $269,000
3
Beds
2
Baths
1,516
Sq Ft
$171/Sq Ft
Est. Value
About This Home
This home is located at 6939 Greenbriar Dr, Parma Heights, OH 44130 and is currently estimated at $259,061, approximately $170 per square foot. 6939 Greenbriar Dr is a home located in Cuyahoga County with nearby schools including Pleasant Valley Elementary School, Greenbriar Middle School, and Valley Forge High School.
Ownership History
Date
Name
Owned For
Owner Type
Purchase Details
Closed on
Jun 10, 2002
Sold by
Kennison Michael R and Kennison Joann M
Bought by
Haberley Robert A and Haberley Corina K
Current Estimated Value
Home Financials for this Owner
Home Financials are based on the most recent Mortgage that was taken out on this home.
Original Mortgage
$114,400
Outstanding Balance
$48,849
Interest Rate
6.95%
Estimated Equity
$210,212
Purchase Details
Closed on
Nov 19, 1998
Sold by
Walahan John M and Walahan Phyllis M
Bought by
Kennison Michael R and Kennison Joann M
Home Financials for this Owner
Home Financials are based on the most recent Mortgage that was taken out on this home.
Original Mortgage
$124,200
Interest Rate
7.01%
Purchase Details
Closed on
Sep 21, 1982
Sold by
Walahan John M and Walahan Phyllis M
Bought by
John M Walahan
Purchase Details
Closed on
Jan 1, 1975
Bought by
Walahan John M and Walahan Phyllis M
Create a Home Valuation Report for This Property
The Home Valuation Report is an in-depth analysis detailing your home's value as well as a comparison with similar homes in the area
Home Values in the Area
Average Home Value in this Area
Purchase History
| Date | Buyer | Sale Price | Title Company |
|---|---|---|---|
| Haberley Robert A | $143,000 | American Title & Trust Agenc | |
| Kennison Michael R | $138,000 | Midland Title Security Inc | |
| John M Walahan | -- | -- | |
| Walahan John M | -- | -- |
Source: Public Records
Mortgage History
| Date | Status | Borrower | Loan Amount |
|---|---|---|---|
| Open | Haberley Robert A | $114,400 | |
| Previous Owner | Kennison Michael R | $124,200 | |
| Closed | Haberley Robert A | $21,450 |
Source: Public Records
Tax History Compared to Growth
Tax History
| Year | Tax Paid | Tax Assessment Tax Assessment Total Assessment is a certain percentage of the fair market value that is determined by local assessors to be the total taxable value of land and additions on the property. | Land | Improvement |
|---|---|---|---|---|
| 2024 | $4,564 | $71,645 | $15,890 | $55,755 |
| 2023 | $4,273 | $58,280 | $12,810 | $45,470 |
| 2022 | $4,249 | $58,280 | $12,810 | $45,470 |
| 2021 | $4,293 | $58,280 | $12,810 | $45,470 |
| 2020 | $4,082 | $49,810 | $10,960 | $38,850 |
| 2019 | $3,970 | $142,300 | $31,300 | $111,000 |
| 2018 | $4,012 | $49,810 | $10,960 | $38,850 |
| 2017 | $3,968 | $45,500 | $9,380 | $36,120 |
| 2016 | $3,940 | $45,500 | $9,380 | $36,120 |
| 2015 | $3,922 | $45,500 | $9,380 | $36,120 |
| 2014 | $3,922 | $45,500 | $9,380 | $36,120 |
Source: Public Records
Map
Nearby Homes
- 6963 Anthony Ln
- 6996 Greenbriar Dr
- 7032 Brandywine Rd
- 6842 Greenbriar Dr
- 8584 Newcomb Dr
- 8375 Royal Ridge Dr
- 8305 Banner Ln
- 9999 W Ridgewood Dr
- 8963 Lynnhaven Rd
- 10438 N Church Dr
- 8767 Lynnhaven Rd
- 10260 Terrace Ct
- 6630 York Rd
- 6525 Aylesworth Dr
- 11043 Meadowbrook Dr
- 9616 W Pleasant Valley Rd
- 6413 Alderwood Rd
- 10839 Tiffany Ln
- 6401 Springwood Rd
- 6418 Newland Rd
- 6945 Greenbriar Dr
- 6935 Greenbriar Dr
- 6951 Greenbriar Dr
- 6951 Greenbriar Dr Unit 30
- 6931 Greenbriar Dr
- 6960 Anthony Ln
- 6966 Anthony Ln
- 6952 Anthony Ln
- 6942 Greenbriar Dr
- 6974 Anthony Ln
- 6936 Greenbriar Dr
- 6957 Greenbriar Dr
- 6927 Greenbriar Dr
- 6946 Anthony Ln
- 6948 Greenbriar Dr
- 6930 Greenbriar Dr
- 7093 Anthony Ln
- 6980 Anthony Ln
- 6954 Greenbriar Dr
- 6938 Anthony Ln