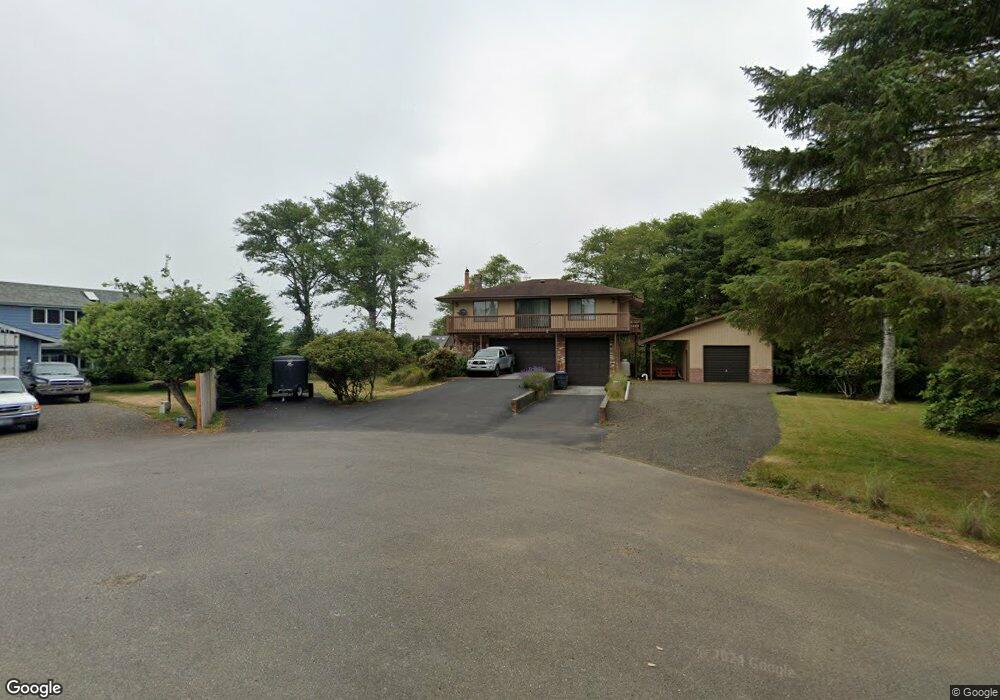
694 Fern Ct SE Ocean Shores, WA 98569
Estimated Value: $432,000 - $523,000
--
Bed
--
Bath
1,160
Sq Ft
$398/Sq Ft
Est. Value
About This Home
This home is located at 694 Fern Ct SE, Ocean Shores, WA 98569 and is currently estimated at $462,254, approximately $398 per square foot. 694 Fern Ct SE is a home located in Grays Harbor County with nearby schools including North Beach Junior/Senior High School.
Ownership History
Date
Name
Owned For
Owner Type
Purchase Details
Closed on
Jul 30, 2020
Sold by
Harrel Patrice Rose and Marshall Thomas Patrick
Bought by
Marshall Thomas Patrick
Current Estimated Value
Home Financials for this Owner
Home Financials are based on the most recent Mortgage that was taken out on this home.
Original Mortgage
$300,000
Outstanding Balance
$264,770
Interest Rate
2.73%
Mortgage Type
New Conventional
Estimated Equity
$197,484
Purchase Details
Closed on
Jul 11, 2019
Sold by
Schliebe Lyle
Bought by
Harrel Patrice Rose and Marshall Thomas Patrick
Home Financials for this Owner
Home Financials are based on the most recent Mortgage that was taken out on this home.
Original Mortgage
$293,584
Interest Rate
4.62%
Mortgage Type
FHA
Purchase Details
Closed on
Nov 17, 2018
Sold by
Schliebe Lyle and Schliebe Living Trust
Bought by
Schliebe Lyle
Purchase Details
Closed on
May 15, 2006
Sold by
Schliebe Lyle
Bought by
Schliebe Lyle and Schliebe Living Trust
Create a Home Valuation Report for This Property
The Home Valuation Report is an in-depth analysis detailing your home's value as well as a comparison with similar homes in the area
Home Values in the Area
Average Home Value in this Area
Purchase History
| Date | Buyer | Sale Price | Title Company |
|---|---|---|---|
| Marshall Thomas Patrick | -- | Amrock Inc | |
| Harrel Patrice Rose | $299,000 | Coast Title | |
| Schliebe Lyle | -- | None Available | |
| Schliebe Lyle | -- | None Available |
Source: Public Records
Mortgage History
| Date | Status | Borrower | Loan Amount |
|---|---|---|---|
| Open | Marshall Thomas Patrick | $300,000 | |
| Closed | Harrel Patrice Rose | $293,584 |
Source: Public Records
Tax History Compared to Growth
Tax History
| Year | Tax Paid | Tax Assessment Tax Assessment Total Assessment is a certain percentage of the fair market value that is determined by local assessors to be the total taxable value of land and additions on the property. | Land | Improvement |
|---|---|---|---|---|
| 2025 | $2,644 | $417,521 | $128,250 | $289,271 |
| 2023 | $2,667 | $415,924 | $127,000 | $288,924 |
| 2022 | $2,382 | $281,745 | $71,500 | $210,245 |
| 2021 | $2,598 | $281,745 | $71,500 | $210,245 |
| 2020 | $2,538 | $251,634 | $71,500 | $180,134 |
| 2019 | $2,174 | $236,556 | $65,000 | $171,556 |
| 2018 | $2,301 | $197,400 | $65,000 | $132,400 |
| 2017 | $2,103 | $212,400 | $80,000 | $132,400 |
| 2016 | $2,311 | $176,535 | $72,000 | $104,535 |
| 2014 | -- | $202,015 | $80,000 | $122,015 |
| 2013 | -- | $229,835 | $100,000 | $129,835 |
Source: Public Records
Map
Nearby Homes
- 681 Lake Island Ave SE
- 671 Duck Lake Dr SE
- 659 Chinook Ave SE
- 723 Trinity Ct SE
- 735 Dover Ct SE
- 737 Wakina Loop SE
- 640 Lake Island Ave SE
- 639 Lake Island Ave SE
- 735 Penninsula Ct SE
- 752 Evergreen Ave SE
- 736 Peninsula Ct
- 742 Peninsula Ct SE
- 598 Blue Wing Loop SE
- 762 Evergreen Ave SE
- 281 Cakesosta St SE
- 764 Tern Ct SE
- 579 Blue Wing Loop SE
- 991 Mount Olympus Ave SE
- 903 Mount Olympus Ave SE
- 804 Meteor Ct SE
- 696 Fern Ct SE
- 692 Fern Ct SE
- 698 Fern Ct SE
- 691 Lake Island Ave SE
- 691 Fern Ct SE
- 689 Lake Island Ave SE
- 693 Fern Ct SE
- 697 Fern Ct SE
- 687 Lake Island Ave SE
- 694 Lake Island Ave SE
- 694 Duck Lake Dr SE
- 685 Lake Island Ave SE
- 700 Wakina Loop SE
- 700 Duck Lake Dr SE
- 714 Syzygy Ct SE
- 716 Syzygy Ct SE
- 690 Lake Island Ave SE
- 683 Lake Island Ave SE