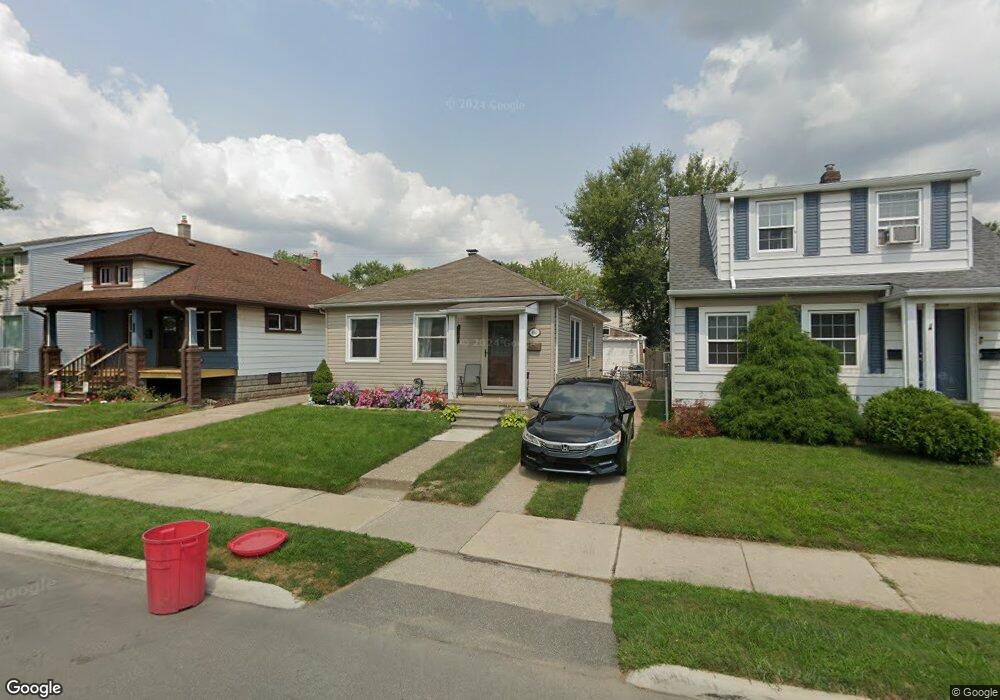
694 Kings Hwy Wyandotte, MI 48192
Estimated Value: $151,123 - $175,000
2
Beds
1
Bath
864
Sq Ft
$187/Sq Ft
Est. Value
About This Home
This home is located at 694 Kings Hwy, Wyandotte, MI 48192 and is currently estimated at $161,531, approximately $186 per square foot. 694 Kings Hwy is a home located in Wayne County with nearby schools including Jefferson Elementary School, Woodrow Wilson School, and Roosevelt High School.
Ownership History
Date
Name
Owned For
Owner Type
Purchase Details
Closed on
Jun 10, 2019
Sold by
Holbrook Nancy G and Rodriguez Nancy
Bought by
Rodriguez Nancy and Rodriguez Glenn
Current Estimated Value
Purchase Details
Closed on
Sep 2, 2016
Sold by
Kondrat Patrick and Kondrat Mary N
Bought by
Holbrook Nancy G
Purchase Details
Closed on
Feb 25, 2010
Sold by
Dandy Susan
Bought by
Us Bank National Association
Purchase Details
Closed on
Aug 31, 2005
Sold by
Mittino Raymond A and Mittino Judith M
Bought by
Dandy Susan
Purchase Details
Closed on
Jun 15, 2005
Sold by
Mittino Raymond A and Mittino Judith M
Bought by
Mittino Raymond A
Create a Home Valuation Report for This Property
The Home Valuation Report is an in-depth analysis detailing your home's value as well as a comparison with similar homes in the area
Home Values in the Area
Average Home Value in this Area
Purchase History
| Date | Buyer | Sale Price | Title Company |
|---|---|---|---|
| Rodriguez Nancy | -- | None Available | |
| Holbrook Nancy G | -- | Attorney | |
| Us Bank National Association | $40,000 | None Available | |
| Dandy Susan | $101,000 | Multiple | |
| Mittino Raymond A | -- | None Available |
Source: Public Records
Tax History Compared to Growth
Tax History
| Year | Tax Paid | Tax Assessment Tax Assessment Total Assessment is a certain percentage of the fair market value that is determined by local assessors to be the total taxable value of land and additions on the property. | Land | Improvement |
|---|---|---|---|---|
| 2025 | $1,686 | $67,100 | $0 | $0 |
| 2024 | $1,686 | $62,300 | $0 | $0 |
| 2023 | $1,608 | $57,100 | $0 | $0 |
| 2022 | $1,862 | $51,300 | $0 | $0 |
| 2021 | $1,825 | $47,700 | $0 | $0 |
| 2020 | $1,800 | $40,200 | $0 | $0 |
| 2019 | $1,775 | $35,500 | $0 | $0 |
| 2018 | $1,417 | $41,600 | $0 | $0 |
| 2017 | $834 | $41,600 | $0 | $0 |
| 2016 | $2,381 | $41,600 | $0 | $0 |
| 2015 | $3,654 | $38,600 | $0 | $0 |
| 2013 | $3,540 | $35,400 | $0 | $0 |
| 2012 | $2,064 | $37,100 | $6,300 | $30,800 |
Source: Public Records
Map
Nearby Homes