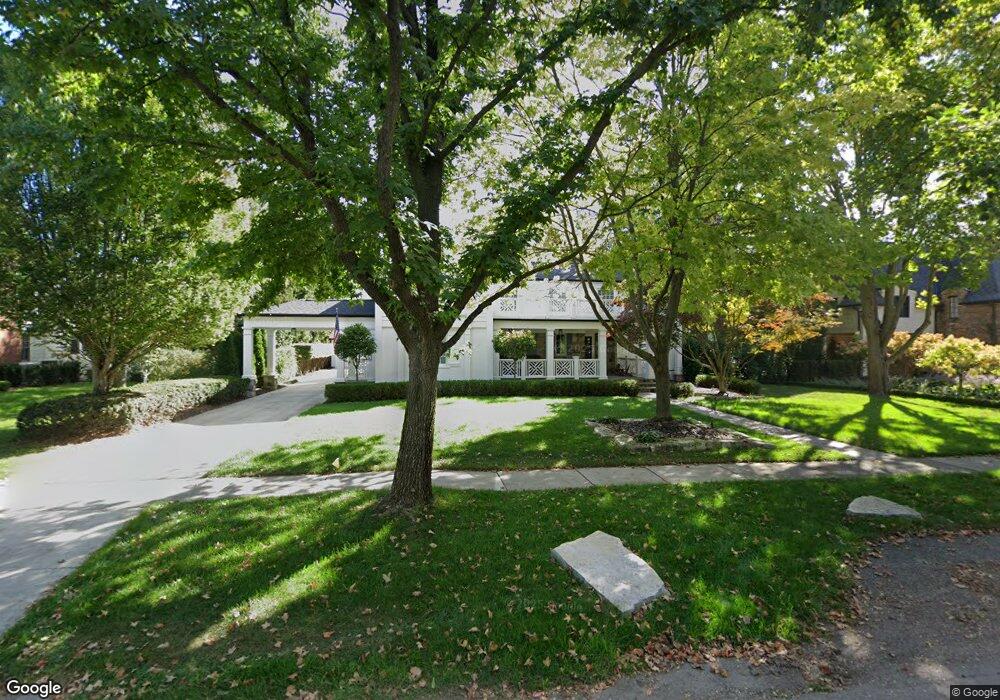
694 Pilgrim Ave Unit Bldg-Unit Birmingham, MI 48009
Estimated Value: $1,795,000 - $2,431,000
4
Beds
4
Baths
3,523
Sq Ft
$573/Sq Ft
Est. Value
About This Home
This home is located at 694 Pilgrim Ave Unit Bldg-Unit, Birmingham, MI 48009 and is currently estimated at $2,018,132, approximately $572 per square foot. 694 Pilgrim Ave Unit Bldg-Unit is a home located in Oakland County with nearby schools including Pierce Elementary School, Ernest W. Seaholm High School, and Holy Name School.
Ownership History
Date
Name
Owned For
Owner Type
Purchase Details
Closed on
Jan 15, 2018
Sold by
Manvel Donald W
Bought by
Aneiros Jeffrey
Current Estimated Value
Purchase Details
Closed on
Jul 27, 2012
Sold by
Manvel Donald W and Manvel Michele L
Bought by
Manvel Donald W and Manvel Michele L
Purchase Details
Closed on
May 1, 2002
Sold by
Maris Gerald A
Bought by
Manvel Michele L
Home Financials for this Owner
Home Financials are based on the most recent Mortgage that was taken out on this home.
Original Mortgage
$550,000
Interest Rate
6.87%
Purchase Details
Closed on
May 28, 1999
Sold by
Condit Michael F
Bought by
Maris Gerald A
Home Financials for this Owner
Home Financials are based on the most recent Mortgage that was taken out on this home.
Original Mortgage
$370,000
Interest Rate
7.06%
Create a Home Valuation Report for This Property
The Home Valuation Report is an in-depth analysis detailing your home's value as well as a comparison with similar homes in the area
Home Values in the Area
Average Home Value in this Area
Purchase History
| Date | Buyer | Sale Price | Title Company |
|---|---|---|---|
| Aneiros Jeffrey | $900,000 | None Available | |
| Manvel Donald W | -- | None Available | |
| Manvel Michele L | -- | -- | |
| Maris Gerald A | $575,000 | -- |
Source: Public Records
Mortgage History
| Date | Status | Borrower | Loan Amount |
|---|---|---|---|
| Previous Owner | Manvel Michele L | $550,000 | |
| Previous Owner | Maris Gerald A | $370,000 |
Source: Public Records
Tax History Compared to Growth
Tax History
| Year | Tax Paid | Tax Assessment Tax Assessment Total Assessment is a certain percentage of the fair market value that is determined by local assessors to be the total taxable value of land and additions on the property. | Land | Improvement |
|---|---|---|---|---|
| 2024 | $20,474 | $852,650 | $0 | $0 |
| 2023 | $19,619 | $795,060 | $0 | $0 |
| 2022 | $21,035 | $773,240 | $0 | $0 |
| 2021 | $21,222 | $750,050 | $0 | $0 |
| 2020 | $18,908 | $725,010 | $0 | $0 |
| 2019 | $21,397 | $510,840 | $0 | $0 |
| 2018 | $19,668 | $610,090 | $0 | $0 |
| 2017 | $19,634 | $597,910 | $0 | $0 |
| 2016 | $19,671 | $574,320 | $0 | $0 |
| 2015 | -- | $543,550 | $0 | $0 |
| 2014 | -- | $514,540 | $0 | $0 |
| 2011 | -- | $411,990 | $0 | $0 |
Source: Public Records
Map
Nearby Homes
- 586 Fairfax St
- 592 Lakeside Dr
- 1056 Pilgrim Ave
- 1882 Melbourne St
- 1834 Fairview St
- 417 Baldwin Rd
- 1030 Lakeside Dr
- 750 Hazelwood St
- 345 Kimberly St
- 222 Arlington St
- 395 Greenwood St
- 1120 Lyonhurst St
- 329 Linden Rd
- 667 Oak Ave
- 956 Westwood Dr
- 1295 Lakeside Dr
- 1260 Lyonhurst St
- 1115 N Old Woodward Ave Unit 52
- 1115 N Old Woodward Ave Unit 61
- 120 Westchester Way
- 694 Pilgrim Ave
- 642 Pilgrim Ave
- 716 Pilgrim Ave
- 659 Puritan Ave Unit Bldg-Unit
- 659 Puritan Ave
- 639 Puritan Ave
- 632 Pilgrim Ave
- 683 Puritan Ave
- 671 Pilgrim Ave
- 750 Pilgrim Ave
- 635 Puritan Ave
- 691 Pilgrim Ave
- 701 Puritan Ave
- 655 Pilgrim Ave
- 584 Pilgrim Ave
- 715 Pilgrim Ave
- 627 Pilgrim Ave
- 579 Puritan Ave
- 747 Puritan Ave
- 798 Pilgrim Ave