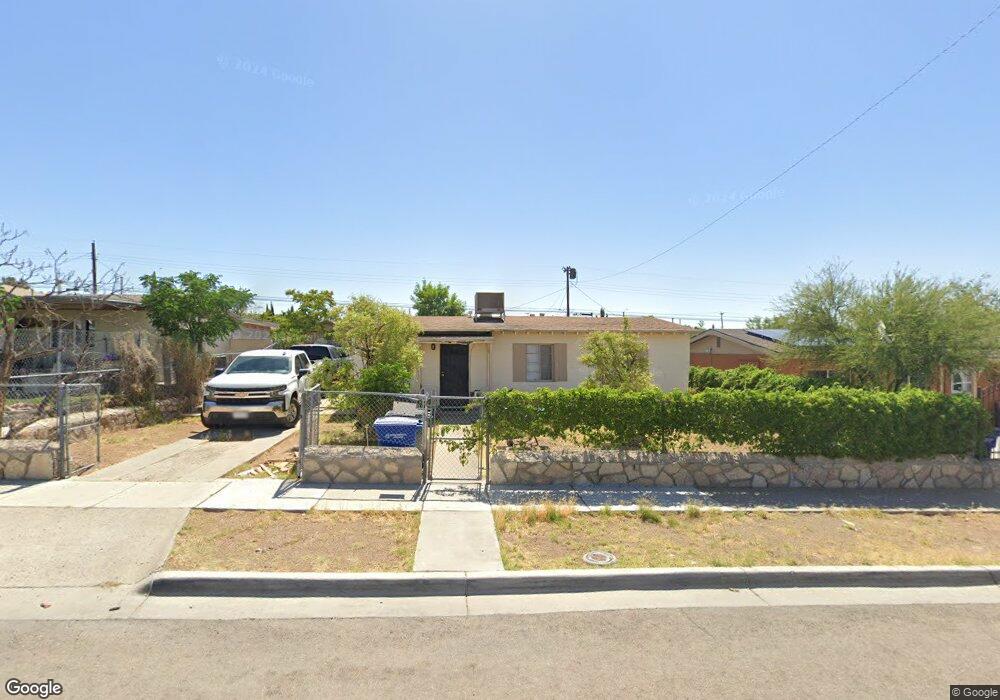
694 Santa Barbara Dr El Paso, TX 79915
Sageland NeighborhoodEstimated Value: $124,000 - $147,000
3
Beds
1
Bath
912
Sq Ft
$148/Sq Ft
Est. Value
About This Home
This home is located at 694 Santa Barbara Dr, El Paso, TX 79915 and is currently estimated at $134,947, approximately $147 per square foot. 694 Santa Barbara Dr is a home located in El Paso County with nearby schools including Sageland Elementary School, Bel Air Middle, and Bel Air High School.
Ownership History
Date
Name
Owned For
Owner Type
Purchase Details
Closed on
Jun 14, 2010
Sold by
Romero Alonso and Romero Maria Luisa
Bought by
Delacruz Richard R and Delacruz Ricardo
Current Estimated Value
Home Financials for this Owner
Home Financials are based on the most recent Mortgage that was taken out on this home.
Original Mortgage
$64,136
Outstanding Balance
$43,570
Interest Rate
5.25%
Mortgage Type
FHA
Estimated Equity
$91,377
Purchase Details
Closed on
May 9, 2007
Sold by
Escarzaga Hector and Escarzaga Jaime
Bought by
Romero Alonso
Home Financials for this Owner
Home Financials are based on the most recent Mortgage that was taken out on this home.
Original Mortgage
$57,000
Interest Rate
6.16%
Mortgage Type
Purchase Money Mortgage
Purchase Details
Closed on
Sep 13, 2001
Sold by
Escarzaga Manuel and Escarzaga Esperanza
Bought by
Escarzaga Hector and Escarzaga Jaime
Create a Home Valuation Report for This Property
The Home Valuation Report is an in-depth analysis detailing your home's value as well as a comparison with similar homes in the area
Home Values in the Area
Average Home Value in this Area
Purchase History
| Date | Buyer | Sale Price | Title Company |
|---|---|---|---|
| Delacruz Richard R | -- | None Available | |
| Romero Alonso | -- | None Available | |
| Escarzaga Hector | -- | -- |
Source: Public Records
Mortgage History
| Date | Status | Borrower | Loan Amount |
|---|---|---|---|
| Open | Delacruz Richard R | $64,136 | |
| Previous Owner | Romero Alonso | $57,000 |
Source: Public Records
Tax History Compared to Growth
Tax History
| Year | Tax Paid | Tax Assessment Tax Assessment Total Assessment is a certain percentage of the fair market value that is determined by local assessors to be the total taxable value of land and additions on the property. | Land | Improvement |
|---|---|---|---|---|
| 2025 | $1,055 | $80,881 | -- | -- |
| 2024 | $1,055 | $73,528 | -- | -- |
| 2023 | $1,055 | $66,844 | $0 | $0 |
| 2022 | $1,887 | $60,767 | $0 | $0 |
| 2021 | $1,796 | $55,243 | $12,247 | $42,996 |
| 2020 | $1,812 | $57,372 | $12,247 | $45,125 |
| 2018 | $1,739 | $55,909 | $12,247 | $43,662 |
| 2017 | $1,830 | $59,854 | $12,247 | $47,607 |
| 2016 | $1,760 | $57,587 | $12,247 | $45,340 |
| 2015 | $1,262 | $57,587 | $12,247 | $45,340 |
| 2014 | $1,262 | $58,849 | $12,247 | $46,602 |
Source: Public Records
Map
Nearby Homes
- 7800 Hermosillo Dr
- 7928 Hermosillo Dr
- 812 Santa Barbara Dr
- 7937 San Paulo Dr
- 844 Santa Barbara Dr
- 7922 Parral Dr
- 7718 Parral Dr
- 7832 Ranchland Dr
- 7713 Matamoros Dr
- 7655 Hacienda Ave
- 7975 Esther Rd
- 740 Draco Place
- 537 Emerson St
- 7761 Maverick Ave
- 7622 Matamoros Dr
- 7921 Lirio Rd
- 8004 Gilbert Dr
- 7542 Hermosillo Dr
- 7909 La Jolla Dr
- 7564 Matamoros Dr
- 694 Santa Barbara Dr Unit 1
- 690 Santa Barbara Dr
- 698 Santa Barbara Dr
- 686 Santa Barbara Dr
- 653 La Paz Dr
- 651 La Paz Dr
- 700 Santa Barbara Dr
- 655 La Paz Dr
- 649 La Paz Dr
- 695 Santa Barbara Dr
- 699 Santa Barbara Dr
- 701 Santa Barbara Dr
- 647 La Paz Dr
- 657 La Paz Dr
- 682 Santa Barbara Dr
- 687 Santa Barbara Dr
- 705 Santa Barbara Dr
- 645 La Paz Dr
- 7833 Hermosillo Dr
- 683 Santa Barbara Dr