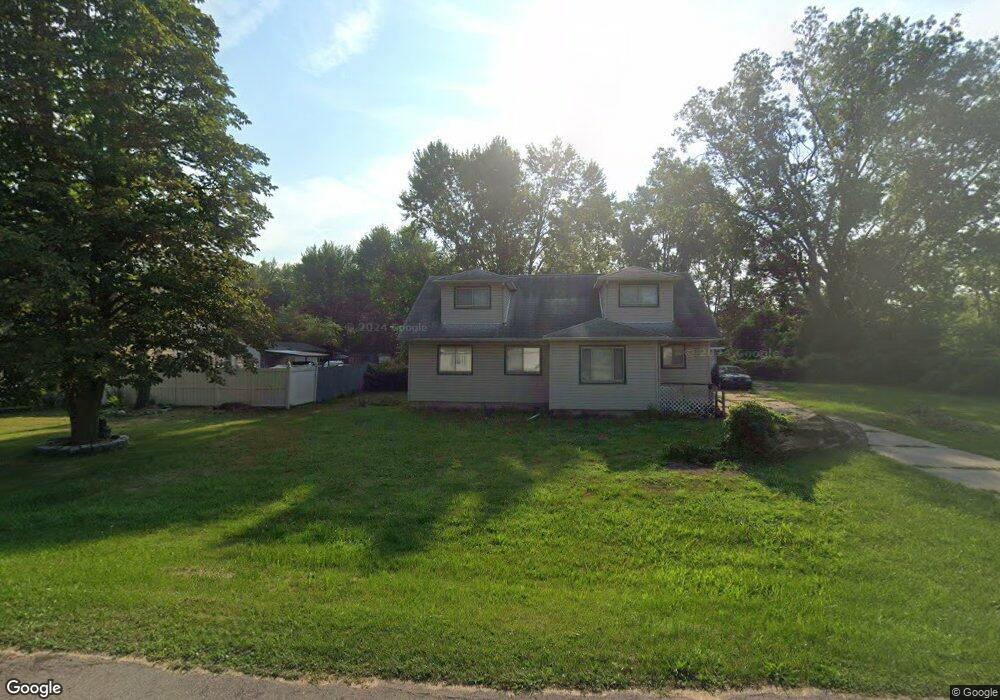
6945 Homefield St Romulus, MI 48174
Estimated Value: $226,000 - $278,000
4
Beds
2
Baths
2,207
Sq Ft
$113/Sq Ft
Est. Value
About This Home
This home is located at 6945 Homefield St, Romulus, MI 48174 and is currently estimated at $249,342, approximately $112 per square foot. 6945 Homefield St is a home located in Wayne County with nearby schools including Romulus Elementary School, Romulus Middle School, and Romulus Senior High School.
Ownership History
Date
Name
Owned For
Owner Type
Purchase Details
Closed on
Jun 23, 2009
Sold by
Wells Fargo Bank National Association
Bought by
Anderson James
Current Estimated Value
Home Financials for this Owner
Home Financials are based on the most recent Mortgage that was taken out on this home.
Original Mortgage
$24,080
Interest Rate
5.62%
Mortgage Type
Purchase Money Mortgage
Purchase Details
Closed on
Feb 22, 2008
Sold by
Mortgage Electronic Registration Systems
Bought by
Wells Fargo Bank Na
Purchase Details
Closed on
Feb 21, 2008
Sold by
Burklo Harvey E and Burklo Judy L
Bought by
Mortgage Electronic Registration Systems
Purchase Details
Closed on
Jul 27, 2004
Sold by
Homefield Development Group Llc
Bought by
Burklo Harvey E
Purchase Details
Closed on
Feb 24, 2004
Sold by
Cohen Josh A and Cohen Karen S
Bought by
Homefield Development Group Llc
Purchase Details
Closed on
Jan 4, 2002
Sold by
Josh A Cohen
Bought by
Josh A Cohen
Create a Home Valuation Report for This Property
The Home Valuation Report is an in-depth analysis detailing your home's value as well as a comparison with similar homes in the area
Home Values in the Area
Average Home Value in this Area
Purchase History
| Date | Buyer | Sale Price | Title Company |
|---|---|---|---|
| Anderson James | $30,100 | None Available | |
| Wells Fargo Bank Na | -- | None Available | |
| Mortgage Electronic Registration Systems | $135,000 | None Available | |
| Burklo Harvey E | $159,900 | Multiple | |
| Homefield Development Group Llc | -- | Multiple | |
| Josh A Cohen | -- | -- |
Source: Public Records
Mortgage History
| Date | Status | Borrower | Loan Amount |
|---|---|---|---|
| Closed | Anderson James | $24,080 |
Source: Public Records
Tax History
| Year | Tax Paid | Tax Assessment Tax Assessment Total Assessment is a certain percentage of the fair market value that is determined by local assessors to be the total taxable value of land and additions on the property. | Land | Improvement |
|---|---|---|---|---|
| 2025 | $1,739 | $86,300 | $0 | $0 |
| 2024 | $1,746 | $75,100 | $0 | $0 |
| 2023 | $1,681 | $64,400 | $0 | $0 |
| 2022 | $1,968 | $61,500 | $0 | $0 |
| 2021 | $1,896 | $57,000 | $0 | $0 |
| 2020 | $1,851 | $72,900 | $0 | $0 |
| 2019 | $1,819 | $68,600 | $0 | $0 |
| 2018 | $1,183 | $43,500 | $0 | $0 |
| 2017 | $876 | $43,400 | $0 | $0 |
| 2016 | $1,567 | $43,700 | $0 | $0 |
| 2015 | $2,977 | $30,900 | $0 | $0 |
| 2013 | $3,530 | $37,600 | $0 | $0 |
| 2012 | $1,108 | $37,500 | $13,900 | $23,600 |
Source: Public Records
Map
Nearby Homes
- 28176 Ecorse Rd
- 6837 Middlebelt Rd
- 7315 Hollywood St
- 27620 Newcastle St
- 28709 S Maple Unit 229
- 0 Ecorse Rd Unit 20251029385
- 6040 Georgia Unit 225
- 6035 Esther St Unit 114
- 6008 E Maple Unit 110
- 6005 Frederick St Unit 56
- 5895 Georgia Unit 180
- 5926 Esther St
- 0 Ecorse Service Rd
- 28638 N Maple St Unit 15
- 28574 N Maple St Unit 7
- 6237 Inkster Rd
- 29120 van Born Rd
- 0 Burton Unit 20251059467
- 27029 Michelle Ct
- 27032 Joan St
- 6925 Homefield St
- 6956 Homefield St
- 6965 Homefield St
- 7005 Homefield St
- 6964 Homefield St
- 6901 Homefield St
- 7004 Homefield St
- 6904 Homefield St
- 6871 Homefield St
- 28800 Ecorse Rd
- 6890 Homefield St
- 28720 Ecorse Rd
- 6870 Homefield St
- 28690 Ecorse Rd
- 28644 Ecorse Rd
- 6849 Homefield St
- 28960 Ecorse Rd
- 28632 Ecorse Rd
- 7020 Harriet St
- 7020 Harriet St
Your Personal Tour Guide
Ask me questions while you tour the home.