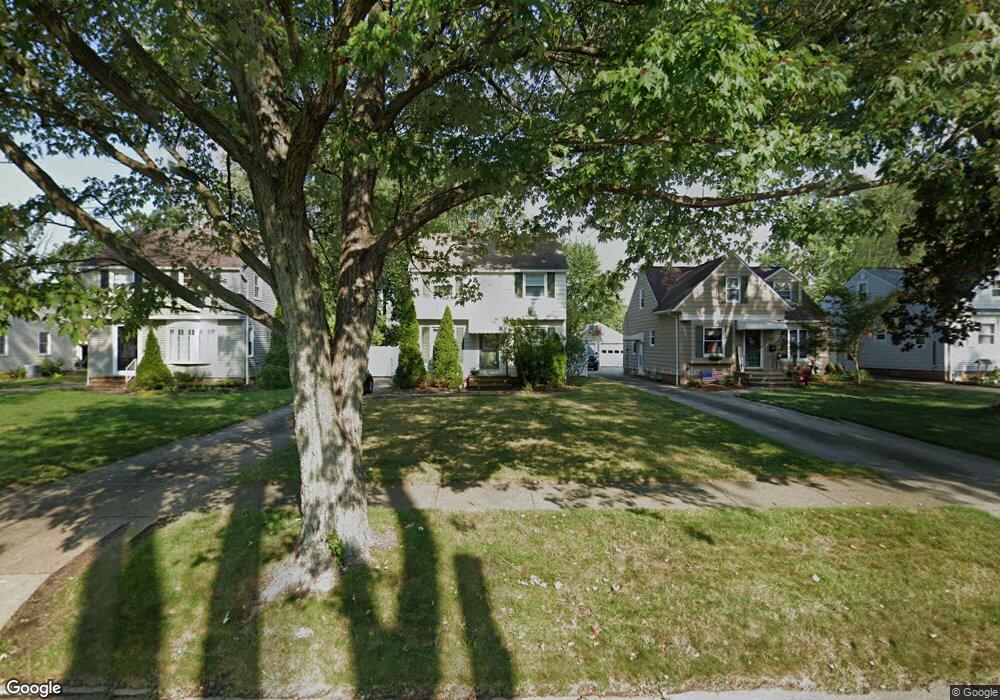
6945 Parma Park Blvd Parma Heights, OH 44130
Estimated Value: $181,000 - $236,000
3
Beds
2
Baths
1,089
Sq Ft
$194/Sq Ft
Est. Value
About This Home
This home is located at 6945 Parma Park Blvd, Parma Heights, OH 44130 and is currently estimated at $211,381, approximately $194 per square foot. 6945 Parma Park Blvd is a home located in Cuyahoga County with nearby schools including Greenbriar Middle School, Pleasant Valley Elementary School, and Valley Forge High School.
Ownership History
Date
Name
Owned For
Owner Type
Purchase Details
Closed on
Mar 30, 2010
Sold by
Neff Deborah
Bought by
Saksa Erin E
Current Estimated Value
Home Financials for this Owner
Home Financials are based on the most recent Mortgage that was taken out on this home.
Original Mortgage
$109,788
Outstanding Balance
$74,910
Interest Rate
5.5%
Mortgage Type
FHA
Estimated Equity
$136,471
Purchase Details
Closed on
May 15, 2009
Sold by
Knopick Beth M and Knopick Michael
Bought by
Neff Deborah and 6945 Parma Park Land Trust
Purchase Details
Closed on
May 18, 1994
Sold by
Bubuli Michael
Bought by
Bubuli Michael
Purchase Details
Closed on
Feb 25, 1994
Sold by
Bubuli Alcie F
Bought by
Bubuli Alcie F
Purchase Details
Closed on
Oct 20, 1981
Sold by
Bubuli Michael and Bubuli Alice F
Bought by
Michael and Bubuli Alcie F
Purchase Details
Closed on
Jan 1, 1975
Bought by
Bubuli Michael and Bubuli Alice F
Create a Home Valuation Report for This Property
The Home Valuation Report is an in-depth analysis detailing your home's value as well as a comparison with similar homes in the area
Home Values in the Area
Average Home Value in this Area
Purchase History
| Date | Buyer | Sale Price | Title Company |
|---|---|---|---|
| Saksa Erin E | $117,900 | Revere Title | |
| Neff Deborah | $27,000 | Revere Title | |
| Bubuli Michael | -- | -- | |
| Bubuli Alcie F | -- | -- | |
| Michael | -- | -- | |
| Bubuli Michael | -- | -- |
Source: Public Records
Mortgage History
| Date | Status | Borrower | Loan Amount |
|---|---|---|---|
| Open | Saksa Erin E | $109,788 |
Source: Public Records
Tax History Compared to Growth
Tax History
| Year | Tax Paid | Tax Assessment Tax Assessment Total Assessment is a certain percentage of the fair market value that is determined by local assessors to be the total taxable value of land and additions on the property. | Land | Improvement |
|---|---|---|---|---|
| 2024 | $4,101 | $64,260 | $12,425 | $51,835 |
| 2023 | $3,673 | $49,770 | $9,800 | $39,970 |
| 2022 | $3,653 | $49,770 | $9,800 | $39,970 |
| 2021 | $3,679 | $49,770 | $9,800 | $39,970 |
| 2020 | $3,316 | $40,150 | $7,910 | $32,240 |
| 2019 | $3,227 | $114,700 | $22,600 | $92,100 |
| 2018 | $3,204 | $40,150 | $7,910 | $32,240 |
| 2017 | $3,191 | $37,210 | $7,140 | $30,070 |
| 2016 | $3,168 | $37,210 | $7,140 | $30,070 |
| 2015 | $3,214 | $37,210 | $7,140 | $30,070 |
| 2014 | $3,214 | $37,980 | $7,280 | $30,700 |
Source: Public Records
Map
Nearby Homes
- 6988 Maplewood Rd
- 11609 Lawndale Dr
- 11770 Barrington Blvd
- 11533 Meadowbrook Dr
- 7230 Greenleaf Ave
- 6697 Parma Park Blvd
- 6682 Parma Park Blvd
- 11043 Meadowbrook Dr
- 6640 Pearl Rd Unit 402
- 7330 Maplewood Rd
- 10761 Blossom Ave
- 12939 W Pleasant Valley Rd
- 12220 Zona Ln
- 10839 Tiffany Ln
- 6375 Sherborn Rd
- 7517 Zona Ln
- 6630 York Rd
- 13493 Pineview Ct
- 10438 N Church Dr
- 6413 Alexandria Dr
- 6949 Parma Park Blvd
- 6939 Parma Park Blvd
- 6953 Parma Park Blvd
- 6935 Parma Park Blvd
- 6959 Parma Park Blvd
- 6929 Parma Park Blvd
- 6965 Parma Park Blvd
- 6925 Parma Park Blvd
- 6950 Orchard Blvd
- 6940 Orchard Blvd
- 6954 Orchard Blvd
- 6971 Parma Park Blvd
- 6936 Orchard Blvd
- 6921 Parma Park Blvd
- 6960 Orchard Blvd
- 6944 Parma Park Blvd
- 6932 Orchard Blvd
- 6940 Parma Park Blvd
- 6950 Parma Park Blvd
- 6966 Orchard Blvd