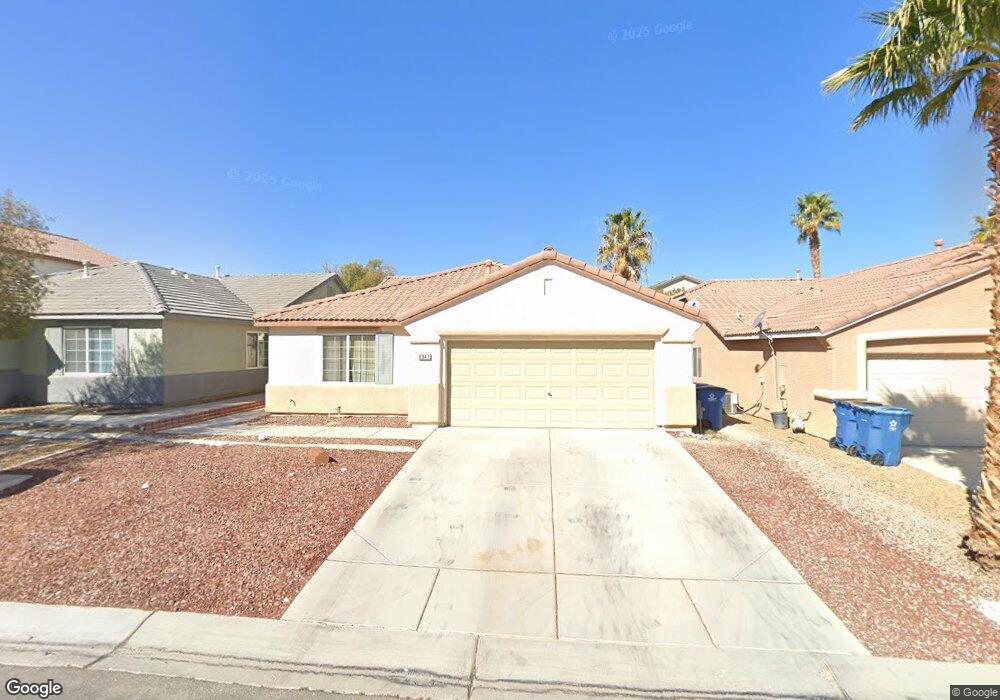
6947 Batik Harbor Ct Las Vegas, NV 89148
Estimated Value: $404,413 - $430,000
2
Beds
2
Baths
1,509
Sq Ft
$279/Sq Ft
Est. Value
About This Home
This home is located at 6947 Batik Harbor Ct, Las Vegas, NV 89148 and is currently estimated at $421,353, approximately $279 per square foot. 6947 Batik Harbor Ct is a home located in Clark County with nearby schools including Wayne N. Tanaka Elementary School, Wilbur & Theresa Faiss Middle School, and Sierra Vista High School.
Ownership History
Date
Name
Owned For
Owner Type
Purchase Details
Closed on
Apr 14, 2016
Sold by
Kwan Philip
Bought by
Kwan Philip and The Philip Kwan Living Trust
Current Estimated Value
Purchase Details
Closed on
May 17, 2011
Sold by
Secretary Of Veterans Affairs
Bought by
Kwan Phillip
Home Financials for this Owner
Home Financials are based on the most recent Mortgage that was taken out on this home.
Original Mortgage
$112,955
Interest Rate
4.73%
Mortgage Type
VA
Purchase Details
Closed on
Nov 21, 2010
Sold by
Carroll Robert W
Bought by
Citimortgage Inc
Purchase Details
Closed on
Nov 13, 2001
Sold by
Carroll Yu Ling Zeng
Bought by
Carroll Robert W
Home Financials for this Owner
Home Financials are based on the most recent Mortgage that was taken out on this home.
Original Mortgage
$167,280
Interest Rate
6.63%
Mortgage Type
VA
Create a Home Valuation Report for This Property
The Home Valuation Report is an in-depth analysis detailing your home's value as well as a comparison with similar homes in the area
Home Values in the Area
Average Home Value in this Area
Purchase History
| Date | Buyer | Sale Price | Title Company |
|---|---|---|---|
| Kwan Philip | -- | None Available | |
| Kwan Phillip | $118,900 | Servicelink Irvine | |
| Citimortgage Inc | $115,451 | None Available | |
| Carroll Robert W | -- | Stewart Title | |
| Carroll Robert W | $164,010 | Stewart Title |
Source: Public Records
Mortgage History
| Date | Status | Borrower | Loan Amount |
|---|---|---|---|
| Previous Owner | Kwan Phillip | $112,955 | |
| Previous Owner | Carroll Robert W | $167,280 |
Source: Public Records
Tax History Compared to Growth
Tax History
| Year | Tax Paid | Tax Assessment Tax Assessment Total Assessment is a certain percentage of the fair market value that is determined by local assessors to be the total taxable value of land and additions on the property. | Land | Improvement |
|---|---|---|---|---|
| 2025 | $1,831 | $105,341 | $38,500 | $66,841 |
| 2024 | $1,778 | $105,341 | $38,500 | $66,841 |
| 2023 | $1,360 | $96,219 | $33,250 | $62,969 |
| 2022 | $1,727 | $85,575 | $28,000 | $57,575 |
| 2021 | $1,599 | $79,227 | $24,500 | $54,727 |
| 2020 | $1,549 | $77,636 | $23,450 | $54,186 |
| 2019 | $1,504 | $74,471 | $21,000 | $53,471 |
| 2018 | $1,435 | $67,856 | $16,450 | $51,406 |
| 2017 | $1,989 | $67,804 | $15,750 | $52,054 |
| 2016 | $1,360 | $60,685 | $11,900 | $48,785 |
| 2015 | $1,359 | $52,760 | $10,850 | $41,910 |
| 2014 | $1,317 | $43,566 | $6,300 | $37,266 |
Source: Public Records
Map
Nearby Homes
- 7011 Azure Beach St
- 9330 W Maule Ave Unit 226
- 9330 W Maule Ave Unit 212
- 9186 Berstler Ave Unit 1A
- 0 Fort Apache Unit 2719841
- 6788 Rose Mallow St Unit 3
- 6768 Pastel Camellia St
- 6867 Dragonfly Rock St
- 6861 Dragonfly Rock St
- 6884 Stonetrace St
- 6837 Dragonfly Rock St
- 9249 Shellmont Ct
- 9299 Adamshurst Ave
- 6770 Firewood Dr
- 9225 Broome Ct
- 9219 Broome Ct
- 9213 Broome Ct
- 9272 Keaton Ave
- 7264 Morrison St
- 8970 Drew Valley Ct
- 6947 Batik Harbor Ct
- 6947 Batik Harbor Ct
- 6947 Batik Harbor Ct
- 6947 Batik Harbor Ct
- 6939 Batik Harbor Ct
- 6955 Batik Harbor Ct
- 6931 Batik Harbor Ct
- 6963 Batik Harbor Ct
- 6948 Night Bloom Ct
- 6940 Night Bloom Ct
- 6956 Night Bloom Ct
- 6971 Batik Harbor Ct
- 6964 Night Bloom Ct
- 6932 Night Bloom Ct
- 6923 Batik Harbor Ct
- 6950 Batik Harbor Ct
- 6942 Batik Harbor Ct
- 6958 Batik Harbor Ct
- 6972 Night Bloom Ct
- 6934 Batik Harbor Ct