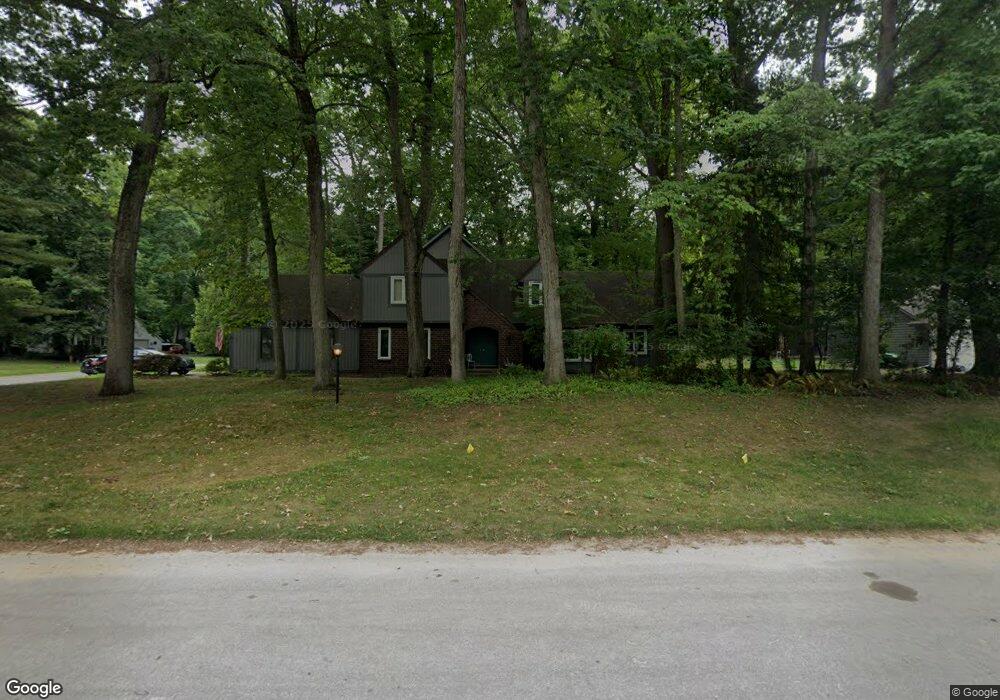
6948 Maplecrest Dr SE Grand Rapids, MI 49546
Estimated Value: $561,000 - $676,000
4
Beds
2
Baths
2,692
Sq Ft
$232/Sq Ft
Est. Value
About This Home
This home is located at 6948 Maplecrest Dr SE, Grand Rapids, MI 49546 and is currently estimated at $625,421, approximately $232 per square foot. 6948 Maplecrest Dr SE is a home located in Kent County with nearby schools including Pine Ridge Elementary School, Central Woodlands 5/6 School, and Central Middle School.
Ownership History
Date
Name
Owned For
Owner Type
Purchase Details
Closed on
Mar 8, 2016
Sold by
Winkelman Grant N and Winkelman Amy B
Bought by
Grant & Amy Winkelman Trust and Winkelman Amy B
Current Estimated Value
Purchase Details
Closed on
Nov 24, 2010
Sold by
Federal Home Loan Mortgage Corporation
Bought by
Winkelman Grant N and Winkleman Amy B
Home Financials for this Owner
Home Financials are based on the most recent Mortgage that was taken out on this home.
Original Mortgage
$125,600
Outstanding Balance
$82,658
Interest Rate
4.22%
Mortgage Type
New Conventional
Estimated Equity
$542,763
Purchase Details
Closed on
Mar 18, 2009
Sold by
Corbitt Richard W and Corbitt Terri P
Bought by
Federal Home Loan Mortgage Corp
Purchase Details
Closed on
Aug 15, 2000
Sold by
Schroer Bruce
Bought by
Corbitt Rick and Winkelman Grant
Create a Home Valuation Report for This Property
The Home Valuation Report is an in-depth analysis detailing your home's value as well as a comparison with similar homes in the area
Home Values in the Area
Average Home Value in this Area
Purchase History
| Date | Buyer | Sale Price | Title Company |
|---|---|---|---|
| Grant & Amy Winkelman Trust | -- | Attorney | |
| Winkelman Grant N | $157,000 | Attorneys Title Agency Llc | |
| Federal Home Loan Mortgage Corp | $231,518 | None Available | |
| Corbitt Rick | $256,900 | -- |
Source: Public Records
Mortgage History
| Date | Status | Borrower | Loan Amount |
|---|---|---|---|
| Open | Winkelman Grant N | $125,600 |
Source: Public Records
Tax History
| Year | Tax Paid | Tax Assessment Tax Assessment Total Assessment is a certain percentage of the fair market value that is determined by local assessors to be the total taxable value of land and additions on the property. | Land | Improvement |
|---|---|---|---|---|
| 2025 | $4,174 | $331,000 | $0 | $0 |
| 2024 | $42 | $311,100 | $0 | $0 |
| 2023 | $3,991 | $280,200 | $0 | $0 |
| 2022 | $5,685 | $254,400 | $0 | $0 |
| 2021 | $5,548 | $245,400 | $0 | $0 |
| 2020 | $3,726 | $234,400 | $0 | $0 |
| 2019 | $5,513 | $218,200 | $0 | $0 |
| 2018 | $5,440 | $202,200 | $0 | $0 |
| 2017 | $5,417 | $192,100 | $0 | $0 |
| 2016 | $5,228 | $182,600 | $0 | $0 |
| 2015 | -- | $182,600 | $0 | $0 |
| 2013 | -- | $124,100 | $0 | $0 |
Source: Public Records
Map
Nearby Homes
- 6862 Maplecrest Dr SE
- 3312 Thornapple River Dr SE
- 7361 Sheffield Dr SE
- 7151 Oran Dr SE
- 7119 Oran Dr SE
- 3131 Howlett Dr SE
- 4011 Buttrick Ave SE
- 7690 Tobemory Ct SE
- 3005 Chapshire Dr SE
- 2757 Cascade Springs Dr SE
- 6657 Waybridge Dr SE
- 7401 Treeline Dr SE
- 2612 Orange Ct SE Unit 6
- 7635 Sandy Hollow Dr SE
- 7734 Thornapple Bayou Dr SE
- 4561 Ada Grove Ct SE
- 6672 Cascade Rd SE
- 7750 Silverthorne Dr SE
- 7901 Sandy Hollow Dr SE
- 4589 Ada Grove Ct SE
- 6928 Maplecrest Dr SE
- 3929 Maplecrest Ct SE
- 6945 Maplecrest Dr SE
- 3900 Maplecrest Ct SE
- 3914 Maplecrest Ct SE
- 6912 Maplecrest Dr SE
- 6959 Maplecrest Dr SE
- 3928 Maplecrest Ct SE
- 6921 Maplecrest Dr SE
- 3941 Maplecrest Ct SE
- 6971 Maplecrest Dr SE
- 3840 Oak Tree Dr SE
- 3944 Maplecrest Ct SE
- 6991 Maplecrest Dr SE
- 3852 Oak Tree St SE
- 6886 Maplecrest Dr SE
- 7000 Maplecrest Dr SE
- 3840 Oak Tree St SE
- 3828 Oak Tree St SE
- 6885 Maplecrest Dr SE
Your Personal Tour Guide
Ask me questions while you tour the home.