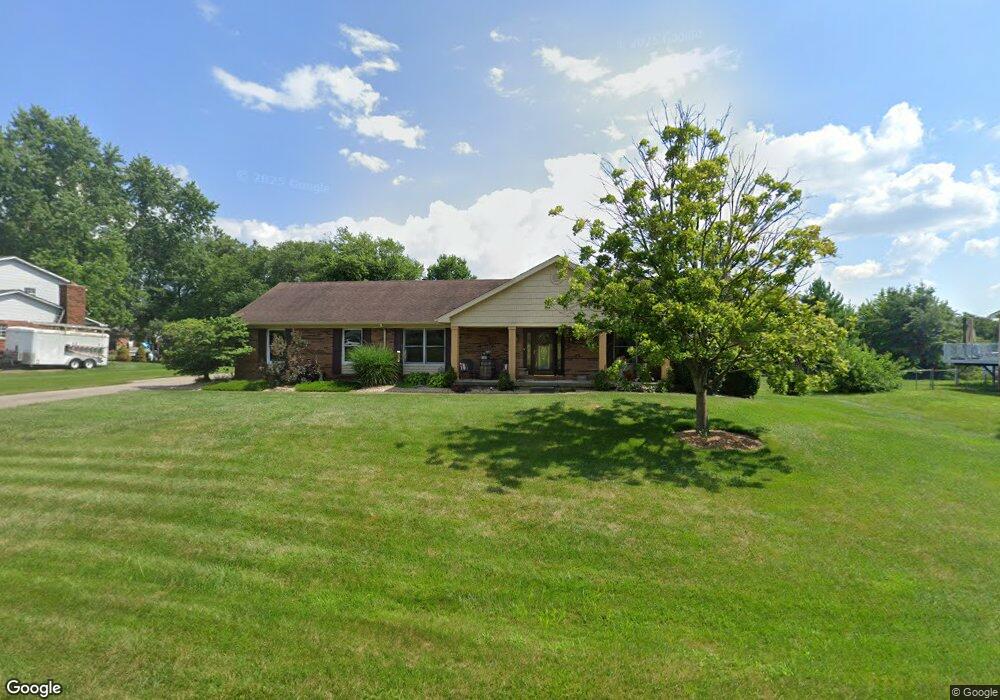
6949 Panther Dr Liberty Township, OH 45044
Estimated Value: $325,000 - $402,000
3
Beds
3
Baths
1,848
Sq Ft
$195/Sq Ft
Est. Value
About This Home
This home is located at 6949 Panther Dr, Liberty Township, OH 45044 and is currently estimated at $361,205, approximately $195 per square foot. 6949 Panther Dr is a home located in Butler County with nearby schools including Independence Elementary School, Liberty Junior School, and Lakota East High School.
Ownership History
Date
Name
Owned For
Owner Type
Purchase Details
Closed on
Jun 14, 2024
Sold by
Corvi Joseph C and Montgomery Angela M
Bought by
Corvi Joseph C and Montgomery Angela M
Current Estimated Value
Purchase Details
Closed on
May 15, 2007
Sold by
Ruehrwein Jayne M
Bought by
Corvi Joseph C
Home Financials for this Owner
Home Financials are based on the most recent Mortgage that was taken out on this home.
Original Mortgage
$187,200
Interest Rate
6.22%
Mortgage Type
Purchase Money Mortgage
Purchase Details
Closed on
Sep 23, 2005
Sold by
Kirby Terry L and Kirby Kim C
Bought by
Corvi Joseph C and Ruehrwein Jayne M
Home Financials for this Owner
Home Financials are based on the most recent Mortgage that was taken out on this home.
Original Mortgage
$177,650
Interest Rate
5.93%
Mortgage Type
Fannie Mae Freddie Mac
Create a Home Valuation Report for This Property
The Home Valuation Report is an in-depth analysis detailing your home's value as well as a comparison with similar homes in the area
Home Values in the Area
Average Home Value in this Area
Purchase History
| Date | Buyer | Sale Price | Title Company |
|---|---|---|---|
| Corvi Joseph C | -- | None Listed On Document | |
| Corvi Joseph C | -- | Attorney | |
| Corvi Joseph C | $187,000 | Custom Land Title Llc |
Source: Public Records
Mortgage History
| Date | Status | Borrower | Loan Amount |
|---|---|---|---|
| Previous Owner | Corvi Joseph C | $187,200 | |
| Previous Owner | Corvi Joseph C | $177,650 |
Source: Public Records
Tax History Compared to Growth
Tax History
| Year | Tax Paid | Tax Assessment Tax Assessment Total Assessment is a certain percentage of the fair market value that is determined by local assessors to be the total taxable value of land and additions on the property. | Land | Improvement |
|---|---|---|---|---|
| 2024 | $3,675 | $94,160 | $13,060 | $81,100 |
| 2023 | $3,630 | $93,470 | $13,060 | $80,410 |
| 2022 | $3,339 | $67,850 | $13,060 | $54,790 |
| 2021 | $3,322 | $67,850 | $13,060 | $54,790 |
| 2020 | $3,408 | $67,850 | $13,060 | $54,790 |
| 2019 | $5,774 | $59,940 | $13,010 | $46,930 |
| 2018 | $3,363 | $59,940 | $13,010 | $46,930 |
| 2017 | $3,427 | $59,940 | $13,010 | $46,930 |
| 2016 | $3,228 | $56,120 | $13,010 | $43,110 |
| 2015 | $3,227 | $56,120 | $13,010 | $43,110 |
| 2014 | $3,233 | $56,130 | $13,010 | $43,120 |
| 2013 | $3,233 | $54,300 | $13,010 | $41,290 |
Source: Public Records
Map
Nearby Homes
- 6872 Fox Trot Ct
- 7095 Kyles Station Rd
- 7025 Welney Run
- 5290 Bligh Ct
- 5502 Rodeo Dr
- 7221 Kyles Station Rd
- 6895 Welney Run
- 7104 Paul Ln
- 5725 Hawthrone Reserve Dr
- 7542 Hickory Knoll Dr
- 7377 Burton Dr
- 6777 Mahogany Ct
- 6534 Justess Ln
- 6551 Lucky Ln
- 7574 Woodmere Ct
- 7108 Shady Brook Bend
- 7113 Shady Brook Bend
- 5019 Yankee Rd
- 5602 Schlade Ct
- 7120 Shady Brook Bend
- 6955 Panther Dr
- 6935 Panther Dr
- 6977 Panther Dr
- 6923 Panther Dr
- 5511 Yankee Rd
- 6946 Panther Dr
- 6960 Panther Dr
- 6932 Panther Dr
- 6993 Panther Dr
- 6911 Panther Dr
- 5499 Yankee Rd
- 6974 Panther Dr
- 6918 Panther Dr
- 6988 Panther Dr
- 6897 Panther Dr
- 5445 Yankee Rd
- 6904 Panther Dr
- 6885 Panther Dr
- 7023 Ivory Ln
- 6933 Kyles Station Rd