695 Black Oak Dr Sparta, GA 31087
Estimated Value: $408,000 - $659,000
--
Bed
--
Bath
2,000
Sq Ft
$270/Sq Ft
Est. Value
About This Home
This home is located at 695 Black Oak Dr, Sparta, GA 31087 and is currently estimated at $539,989, approximately $269 per square foot. 695 Black Oak Dr is a home with nearby schools including Lewis Elementary School, Hancock Central Middle School, and Hancock Central High School.
Ownership History
Date
Name
Owned For
Owner Type
Purchase Details
Closed on
Feb 26, 2019
Sold by
Carrico Paul E
Bought by
Martin Kenny
Current Estimated Value
Home Financials for this Owner
Home Financials are based on the most recent Mortgage that was taken out on this home.
Original Mortgage
$120,000
Interest Rate
4.4%
Mortgage Type
New Conventional
Purchase Details
Closed on
Sep 4, 2008
Sold by
Mcdaniel George S
Bought by
Carrico Paul E and Carrico Leslie
Home Financials for this Owner
Home Financials are based on the most recent Mortgage that was taken out on this home.
Original Mortgage
$101,683
Interest Rate
5%
Mortgage Type
New Conventional
Purchase Details
Closed on
Feb 26, 1999
Sold by
Dixon Dixon H and Dixon Doro
Bought by
Mcdaniel George S
Purchase Details
Closed on
Jul 25, 1997
Sold by
Griffis Hugh D
Bought by
Dixon Dixon H and Dixon Doro
Create a Home Valuation Report for This Property
The Home Valuation Report is an in-depth analysis detailing your home's value as well as a comparison with similar homes in the area
Home Values in the Area
Average Home Value in this Area
Purchase History
| Date | Buyer | Sale Price | Title Company |
|---|---|---|---|
| Martin Kenny | $142,000 | -- | |
| Carrico Paul E | $145,000 | -- | |
| Mcdaniel George S | $20,000 | -- | |
| Dixon Dixon H | $18,000 | -- |
Source: Public Records
Mortgage History
| Date | Status | Borrower | Loan Amount |
|---|---|---|---|
| Closed | Martin Kenny | $120,000 | |
| Previous Owner | Carrico Paul E | $101,683 |
Source: Public Records
Tax History Compared to Growth
Tax History
| Year | Tax Paid | Tax Assessment Tax Assessment Total Assessment is a certain percentage of the fair market value that is determined by local assessors to be the total taxable value of land and additions on the property. | Land | Improvement |
|---|---|---|---|---|
| 2024 | $3,370 | $104,502 | $44,800 | $59,702 |
| 2023 | $3,389 | $104,502 | $44,800 | $59,702 |
| 2022 | $3,332 | $104,502 | $44,800 | $59,702 |
| 2021 | $2,749 | $86,027 | $44,800 | $41,227 |
| 2020 | $1,680 | $52,523 | $44,800 | $7,723 |
| 2019 | $1,681 | $52,523 | $44,800 | $7,723 |
| 2018 | $1,516 | $48,523 | $40,800 | $7,723 |
| 2017 | $1,287 | $48,523 | $40,800 | $7,723 |
| 2016 | $1,785 | $57,146 | $48,000 | $9,146 |
| 2015 | -- | $57,146 | $48,000 | $9,146 |
| 2014 | -- | $57,146 | $48,000 | $9,146 |
| 2013 | -- | $57,145 | $48,000 | $9,145 |
Source: Public Records
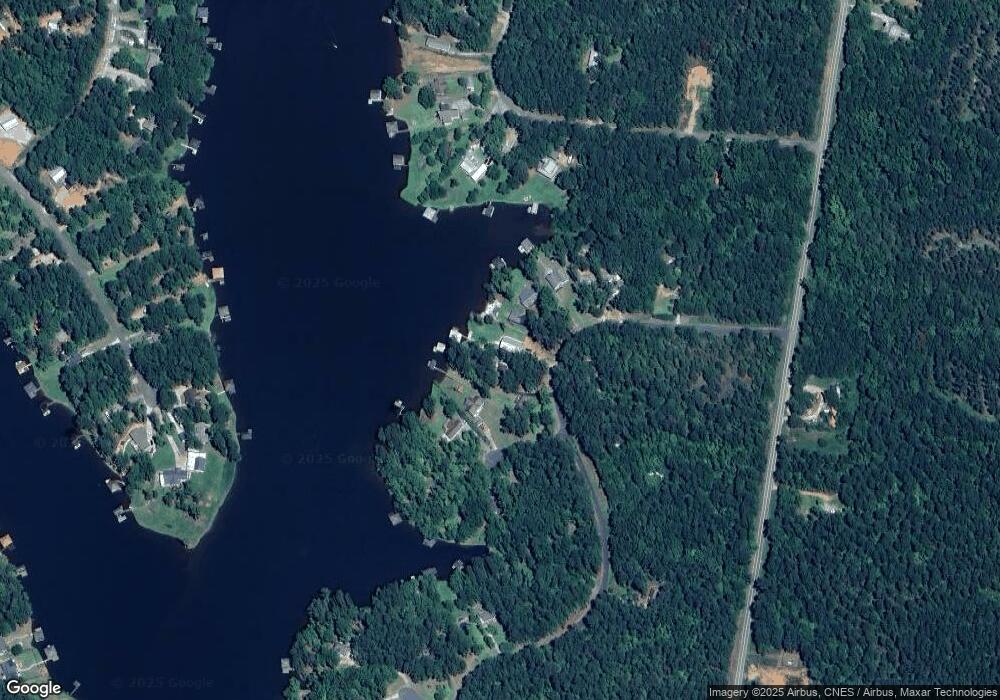
Map
Nearby Homes
- 451 Loblolly Dr
- 401 Black Oak Dr
- 24 Black Jack Ln
- 591 Black Oak Dr
- 815 Morning Glory Dr
- 0 Lake Sinclair Dr Unit 7576429
- 0 Lake Sinclair Dr Unit 10632961
- 15 Black Oak Ct
- 0 Danthus Dr Unit 7576422
- lot 92 Sycamore Dr
- 0 Camellia Ct Unit 10594411
- 0 Camellia Ct Unit 7637497
- 0 Dianthus Dr Unit 10632998
- 0 Day Lilly Ln
- 578 Gardenia Rd
- LOT 12 Horseshoe Dr
- 0 Poinsettia Place
- 217 Sycamore Dr
- Lt.495 Island Creek Dr
- 0 Anthemis Dr Unit 7576411
- 677 Black Oak Dr
- 50 Blue Jack Ct
- 719 Black Oak Dr
- 714 Black Oak Dr
- 0 Blackjack Ct Unit 8290157
- 735 Black Oak Dr
- 363 Black Oak Dr
- 363 Black Oak Dr Unit 269
- 49 Blue Jack Ct
- 55 Blue Jack Ct
- 53 Blue Jack Ct
- 195 Cedar Dr
- 197 Cedar Dr
- 151 Cedar Dr
- 610 Black Oak Dr
- 191 Cedar Dr
- 269 Black Oak Dr
- 207 Cedar Dr
- 67 Cedar Dr
- 477 Black Oak Dr