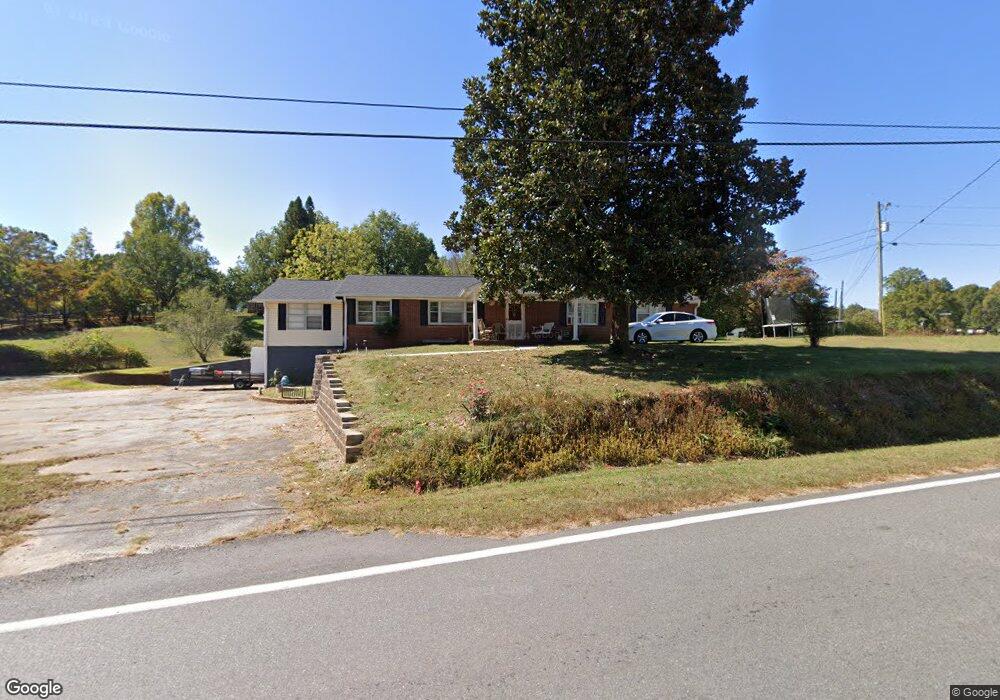
695 Camp Wahsega Rd Dahlonega, GA 30533
Estimated Value: $271,754 - $388,000
--
Bed
2
Baths
1,575
Sq Ft
$203/Sq Ft
Est. Value
About This Home
This home is located at 695 Camp Wahsega Rd, Dahlonega, GA 30533 and is currently estimated at $320,439, approximately $203 per square foot. 695 Camp Wahsega Rd is a home located in Lumpkin County with nearby schools including Clay County Middle School and Lumpkin County High School.
Ownership History
Date
Name
Owned For
Owner Type
Purchase Details
Closed on
May 21, 2024
Sold by
Jones Murl Dennis
Bought by
Jones Carol Sue Lunsford and Lunsford Jones Carol
Current Estimated Value
Home Financials for this Owner
Home Financials are based on the most recent Mortgage that was taken out on this home.
Original Mortgage
$220,000
Outstanding Balance
$217,082
Interest Rate
7.17%
Mortgage Type
New Conventional
Estimated Equity
$103,357
Purchase Details
Closed on
Apr 23, 2024
Sold by
Jones Murl Dennis
Bought by
Jones Murl D and Jones Sue L
Home Financials for this Owner
Home Financials are based on the most recent Mortgage that was taken out on this home.
Original Mortgage
$220,000
Outstanding Balance
$217,082
Interest Rate
7.17%
Mortgage Type
New Conventional
Estimated Equity
$103,357
Purchase Details
Closed on
Nov 15, 2013
Sold by
Jones Johnnie Paul
Bought by
Jones Jones Murl Dennis Murl Dennis and Jones Dalton Glenda Gail
Purchase Details
Closed on
Aug 31, 2000
Bought by
Jones Johnnie Paul
Create a Home Valuation Report for This Property
The Home Valuation Report is an in-depth analysis detailing your home's value as well as a comparison with similar homes in the area
Home Values in the Area
Average Home Value in this Area
Purchase History
| Date | Buyer | Sale Price | Title Company |
|---|---|---|---|
| Jones Carol Sue Lunsford | -- | -- | |
| Jones Murl D | -- | -- | |
| Jones Jones Murl Dennis Murl Dennis | -- | -- | |
| Jones Johnnie Paul | -- | -- |
Source: Public Records
Mortgage History
| Date | Status | Borrower | Loan Amount |
|---|---|---|---|
| Open | Jones Carol Sue Lunsford | $220,000 |
Source: Public Records
Tax History Compared to Growth
Tax History
| Year | Tax Paid | Tax Assessment Tax Assessment Total Assessment is a certain percentage of the fair market value that is determined by local assessors to be the total taxable value of land and additions on the property. | Land | Improvement |
|---|---|---|---|---|
| 2024 | $1,822 | $66,430 | $10,565 | $55,865 |
| 2023 | $1,459 | $62,028 | $9,605 | $52,423 |
| 2022 | $1,462 | $59,042 | $8,004 | $51,038 |
| 2021 | $1,324 | $51,724 | $8,004 | $43,720 |
| 2020 | $1,327 | $50,311 | $7,670 | $42,641 |
| 2019 | $1,339 | $50,311 | $7,670 | $42,641 |
| 2018 | $1,309 | $46,144 | $7,670 | $38,474 |
| 2017 | $1,360 | $47,002 | $7,670 | $39,332 |
| 2016 | $1,274 | $42,608 | $7,670 | $34,938 |
| 2015 | $1,137 | $42,608 | $7,670 | $34,938 |
| 2014 | $1,137 | $43,113 | $7,670 | $35,443 |
| 2013 | -- | $44,123 | $7,670 | $36,453 |
Source: Public Records
Map
Nearby Homes
- 22 Deer Ridge Rd
- 955 Camp Wahsega Rd
- 357 Camp Wahsega Rd
- 70 Avery Trail
- 0 Camp Wahsega Rd Unit 7600956
- 0 Camp Wahsega Rd Unit 10547292
- 96 Elbert Gaddis Rd
- 98 Elbert Gaddis Rd
- 181 Gilreath Way
- 26 Dowdy Ct
- 122 Tritt Rd
- 1879 Camp Wahsega Rd
- 64 Hickory Ln
- 239 Glenn Elliott Rd
- LOT 1 the Overlook at Crown Mountain
- Tr 3 Glenn Elliot Rd
- 1202 Oak Grove Rd
- 81 Anderson Dr
- 77 Old River Rd
- 0 Cherrystone Walk
- 549 John W Moore Rd
- 0 Colony Dr
- 738 Camp Wahsega Rd
- 76 Colony Dr
- 580 John W Moore Rd
- 81 Cherrystone Walk
- 0 Black Mountain Rd Unit 5974871
- 0 Black Mountain Rd Unit 8342576
- 0 Black Mountain Rd Unit LOT 7 7253424
- 0 Black Mountain Rd Unit LOT 6 7253419
- 0 Black Mountain Rd Unit LOT 5 7253411
- 0 Black Mountain Rd Unit LOT 4 7253400
- 0 Black Mountain Rd Unit LOT 2 7253390
- 0 Black Mountain Rd Unit LOT 1 7253380
- 0 Black Mountain Rd Unit LOT 7 8022845
- 0 Black Mountain Rd Unit LOT 6 8022843
- 0 Black Mountain Rd Unit LOT 5 8022841
- 0 Black Mountain Rd Unit LOT 4 8022839
- 0 Black Mountain Rd Unit LOT 2 8022835