Estimated Value: $407,000
6
Beds
4
Baths
5,200
Sq Ft
$78/Sq Ft
Est. Value
About This Home
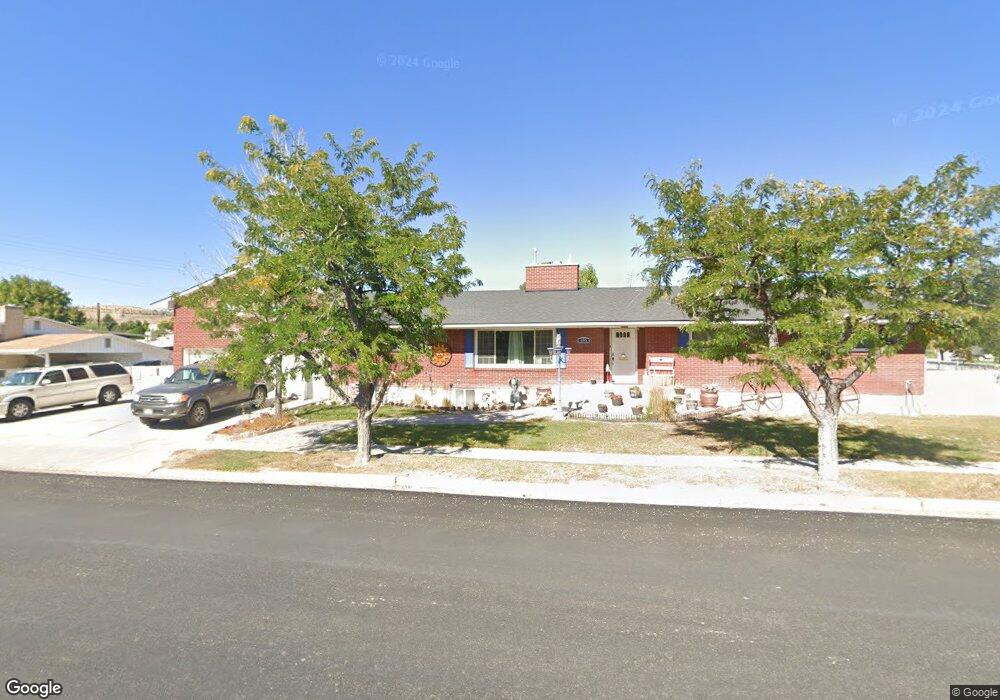
This home is located at 695 E 800 N, Price, UT 84501 and is currently estimated at $407,000, approximately $78 per square foot. 695 E 800 N is a home located in Carbon County with nearby schools including Castle Heights School, Mont Harmon Junior High School, and Carbon High School.
Ownership History
Date
Name
Owned For
Owner Type
Purchase Details
Closed on
Sep 16, 2020
Sold by
Atwood Barry and Polster Susan
Bought by
Genta Carl and Genta Joan
Current Estimated Value
Purchase Details
Closed on
Aug 3, 2018
Sold by
Mantz Eric D and Mantz Natalie M
Bought by
Genta Carl and Genta Joann
Home Financials for this Owner
Home Financials are based on the most recent Mortgage that was taken out on this home.
Original Mortgage
$213,069
Interest Rate
4.37%
Mortgage Type
FHA
Create a Home Valuation Report for This Property
The Home Valuation Report is an in-depth analysis detailing your home's value as well as a comparison with similar homes in the area
Purchase History
| Date | Buyer | Sale Price | Title Company |
|---|---|---|---|
| Genta Carl | -- | South Eastern Utah Title Co | |
| Genta Carl | -- | South Eastern Utah Title Co |
Source: Public Records
Mortgage History
| Date | Status | Borrower | Loan Amount |
|---|---|---|---|
| Previous Owner | Genta Carl | $213,069 |
Source: Public Records
Tax History
| Year | Tax Paid | Tax Assessment Tax Assessment Total Assessment is a certain percentage of the fair market value that is determined by local assessors to be the total taxable value of land and additions on the property. | Land | Improvement |
|---|---|---|---|---|
| 2025 | $3,550 | $531,247 | $61,339 | $469,908 |
| 2024 | $2,827 | $427,876 | $36,300 | $391,576 |
| 2023 | $2,651 | $427,919 | $31,962 | $395,957 |
| 2022 | $2,651 | $384,001 | $26,574 | $357,427 |
| 2021 | $2,276 | $281,336 | $22,331 | $259,005 |
| 2020 | $2,201 | $136,533 | $0 | $0 |
| 2019 | $1,954 | $127,129 | $0 | $0 |
| 2018 | $1,874 | $124,368 | $0 | $0 |
| 2017 | $1,851 | $124,368 | $0 | $0 |
| 2016 | $1,669 | $124,368 | $0 | $0 |
| 2015 | $1,669 | $124,368 | $0 | $0 |
| 2014 | $1,658 | $124,368 | $0 | $0 |
| 2013 | $1,840 | $136,652 | $0 | $0 |
Source: Public Records
Map
Nearby Homes
Your Personal Tour Guide
Ask me questions while you tour the home.