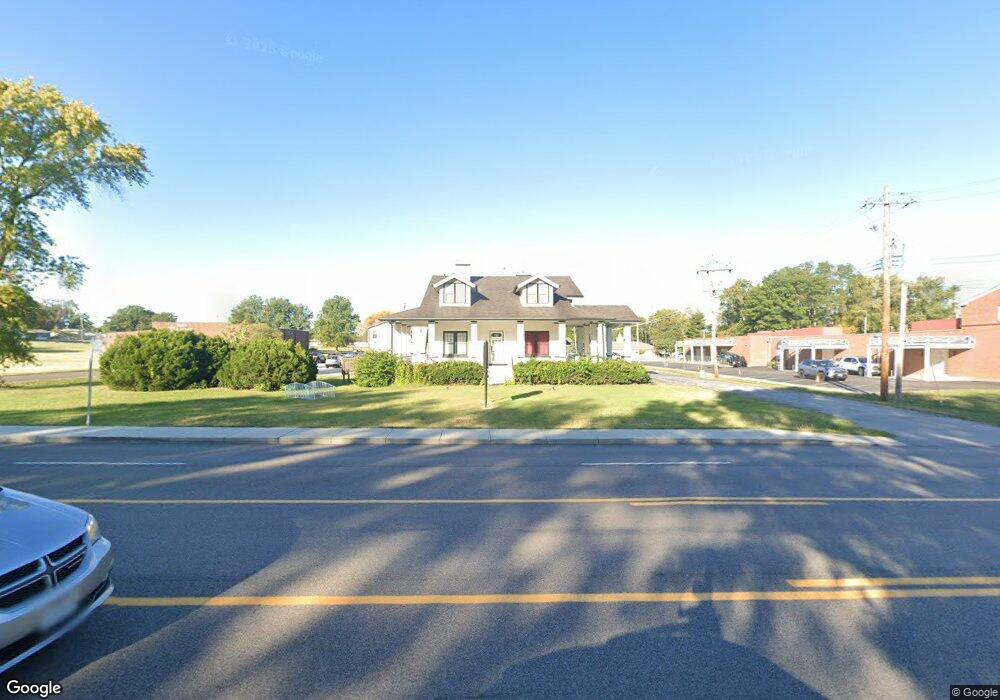
695 Graham Rd Florissant, MO 63031
Estimated Value: $625,463
--
Bed
--
Bath
8,325
Sq Ft
$75/Sq Ft
Est. Value
About This Home
This home is located at 695 Graham Rd, Florissant, MO 63031 and is currently estimated at $625,463, approximately $75 per square foot. 695 Graham Rd is a home located in St. Louis County with nearby schools including Combs Elementary School, Cross Keys Middle School, and McCluer North High School.
Ownership History
Date
Name
Owned For
Owner Type
Purchase Details
Closed on
Apr 17, 2024
Sold by
Bait Ministry Christian Center and Bait Ministry Center Llc
Bought by
Green Haven Adult Day Program Llc
Current Estimated Value
Home Financials for this Owner
Home Financials are based on the most recent Mortgage that was taken out on this home.
Original Mortgage
$306,400
Outstanding Balance
$301,822
Interest Rate
6.88%
Mortgage Type
New Conventional
Estimated Equity
$323,641
Purchase Details
Closed on
Sep 19, 2012
Sold by
Daniel Michael J and Daniel Cara S
Bought by
B A I T Ministry Christian Center
Home Financials for this Owner
Home Financials are based on the most recent Mortgage that was taken out on this home.
Original Mortgage
$250,000
Interest Rate
3.66%
Mortgage Type
Seller Take Back
Create a Home Valuation Report for This Property
The Home Valuation Report is an in-depth analysis detailing your home's value as well as a comparison with similar homes in the area
Home Values in the Area
Average Home Value in this Area
Purchase History
| Date | Buyer | Sale Price | Title Company |
|---|---|---|---|
| Green Haven Adult Day Program Llc | -- | Investors Title Company | |
| B A I T Ministry Christian Center | $275,000 | Investors Title Co Clayton |
Source: Public Records
Mortgage History
| Date | Status | Borrower | Loan Amount |
|---|---|---|---|
| Open | Green Haven Adult Day Program Llc | $306,400 | |
| Previous Owner | B A I T Ministry Christian Center | $250,000 |
Source: Public Records
Tax History Compared to Growth
Tax History
| Year | Tax Paid | Tax Assessment Tax Assessment Total Assessment is a certain percentage of the fair market value that is determined by local assessors to be the total taxable value of land and additions on the property. | Land | Improvement |
|---|---|---|---|---|
| 2025 | $19,793 | $159,740 | $44,030 | $115,710 |
| 2024 | $19,793 | $176,570 | $44,030 | $132,540 |
| 2023 | $19,619 | $176,570 | $44,030 | $132,540 |
| 2022 | $13,947 | $119,810 | $44,030 | $75,780 |
| 2021 | $13,647 | $119,810 | $44,030 | $75,780 |
| 2020 | $11,586 | $101,820 | $44,030 | $57,790 |
| 2019 | $11,233 | $101,820 | $44,030 | $57,790 |
| 2018 | $10,581 | $90,750 | $44,030 | $46,720 |
| 2017 | $10,434 | $90,750 | $44,030 | $46,720 |
| 2016 | $10,654 | $90,240 | $46,400 | $43,840 |
| 2015 | $10,681 | $90,240 | $46,400 | $43,840 |
| 2014 | $11,487 | $99,130 | $62,750 | $36,380 |
Source: Public Records
Map
Nearby Homes
- 630 Graham Rd
- 50 Saint Walter Ln
- 540 S Jefferson St
- 15 Henson Ln
- 279 Elmdale Ct
- 216 Graham Rd
- 200 Calbreath Ct
- 7731 Hazelcrest Dr Unit H
- 7604 Hazelcrest Dr Unit C
- 305 S Lafayette St
- 7641 Hazelcrest Dr Unit 47
- 7594 Hazelcrest Dr Unit B
- 937 Cades Cove
- 201 Brower Ln
- 580 Saint Marie St
- 7520 Hazelcrest Dr Unit 227
- 7450 Sieloff Dr Unit B
- 7446 Sieloff Dr Unit H
- 175 Clark St
- 7497 Hazelcrest Dr Unit F
- 660 Graham Rd
- 600 Graham Rd
- 700 Graham Rd
- 15 Saint Walter Ln
- 20 Saint Virgil Ln
- 20 Saint Walter Ln
- 25 Saint Walter Ln
- 730 Graham Rd
- 28 Ridgelawn Ct
- 30 Saint Virgil Ln
- 30 Saint Walter Ln
- 27 Ridgelawn Ct
- 560 Graham Rd
- 35 Saint Walter Ln
- 555 Graham Rd
- 760 Graham Rd
- 26 Ridgelawn Ct
- 40 Saint Virgil Ln
- 15 Saint Virgil Ln
- 40 Saint Walter Ln