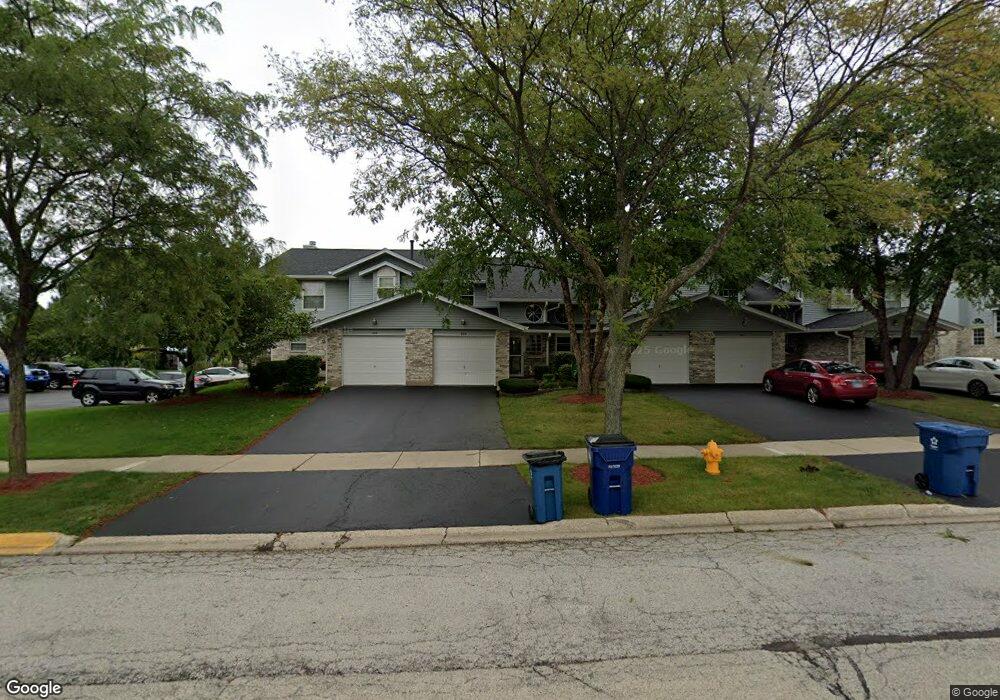
695 N Meadows Blvd Unit T4 Addison, IL 60101
Estimated Value: $269,638 - $295,000
2
Beds
2
Baths
1,267
Sq Ft
$223/Sq Ft
Est. Value
About This Home
This home is located at 695 N Meadows Blvd Unit T4, Addison, IL 60101 and is currently estimated at $282,660, approximately $223 per square foot. 695 N Meadows Blvd Unit T4 is a home located in DuPage County with nearby schools including Marquardt Middle School, Glenbard East High School, and St Philip The Apostle School.
Ownership History
Date
Name
Owned For
Owner Type
Purchase Details
Closed on
Jun 18, 2018
Sold by
Aviles Juanita Vera and Coimbra Paulo
Bought by
Aviles Juanita Vera and Aviles Marco A
Current Estimated Value
Purchase Details
Closed on
Jul 16, 2010
Sold by
Vera Juanita and Aviles Marco
Bought by
Vera Juanita and Coimbra Paulo A
Home Financials for this Owner
Home Financials are based on the most recent Mortgage that was taken out on this home.
Original Mortgage
$70,000
Outstanding Balance
$46,236
Interest Rate
4.6%
Mortgage Type
New Conventional
Estimated Equity
$236,424
Purchase Details
Closed on
Nov 7, 1997
Sold by
Brown Richard D and Brown Sharon C
Bought by
Aviles Marco and Vera Juana
Home Financials for this Owner
Home Financials are based on the most recent Mortgage that was taken out on this home.
Original Mortgage
$84,000
Interest Rate
7.46%
Create a Home Valuation Report for This Property
The Home Valuation Report is an in-depth analysis detailing your home's value as well as a comparison with similar homes in the area
Home Values in the Area
Average Home Value in this Area
Purchase History
| Date | Buyer | Sale Price | Title Company |
|---|---|---|---|
| Aviles Juanita Vera | -- | Premier Title | |
| Vera Juanita | -- | Premier Title | |
| Aviles Marco | $105,000 | Attorneys Natl Title Guarant |
Source: Public Records
Mortgage History
| Date | Status | Borrower | Loan Amount |
|---|---|---|---|
| Open | Vera Juanita | $70,000 | |
| Closed | Aviles Marco | $84,000 |
Source: Public Records
Tax History Compared to Growth
Tax History
| Year | Tax Paid | Tax Assessment Tax Assessment Total Assessment is a certain percentage of the fair market value that is determined by local assessors to be the total taxable value of land and additions on the property. | Land | Improvement |
|---|---|---|---|---|
| 2024 | $6,424 | $74,959 | $13,964 | $60,995 |
| 2023 | $5,991 | $68,550 | $12,770 | $55,780 |
| 2022 | $5,522 | $59,040 | $9,000 | $50,040 |
| 2021 | $5,371 | $56,090 | $8,550 | $47,540 |
| 2020 | $5,408 | $57,740 | $8,340 | $49,400 |
| 2019 | $5,175 | $55,480 | $8,010 | $47,470 |
| 2018 | $4,334 | $44,190 | $6,380 | $37,810 |
| 2017 | $4,086 | $40,950 | $5,910 | $35,040 |
| 2016 | $3,874 | $37,900 | $5,470 | $32,430 |
| 2015 | $3,769 | $35,360 | $5,100 | $30,260 |
| 2014 | $3,473 | $32,910 | $4,750 | $28,160 |
| 2013 | $3,513 | $34,030 | $4,910 | $29,120 |
Source: Public Records
Map
Nearby Homes
- 941 N Swift Rd Unit 301
- 881 N Swift Rd Unit 206
- 823 N Harrow Ct
- 818 N Rumple Ln
- 953 N Rohlwing Rd Unit GB
- 943 N Rohlwing Rd Unit 101H
- 1750 W Woodland Ave
- 22W070 Byron Ave
- 1527 W Holtz Ave
- 20W561 Army Trail Blvd
- 367 Golfview Ct
- 1660 W Prescott Place
- 5N260 Eagle Terrace
- 323 Morningside Dr Unit B
- 2 Willow Bridge Way
- 316 Morningside Dr Unit A
- 5N210 Central Rd
- 1210 N Foxdale Dr Unit 109
- 580 N Highlander Way
- 1275 W Lake St Unit 104
- 699 N Meadows Blvd
- 691 N Meadows Blvd
- 687 N Meadows Blvd Unit T2
- 683 N Meadows Blvd Unit T1
- 684 N Tamarac Blvd Unit DD6
- 686 N Tamarac Blvd Unit CC1
- 701 N Meadows Blvd Unit U1
- 688 N Tamarac Blvd Unit 2
- 679 N Meadows Blvd Unit S6
- 690 N Tamarac Blvd Unit CC3
- 682 N Tamarac Blvd Unit DD5
- 692 N Tamarac Blvd Unit CC4
- 705 N Meadows Blvd Unit U2
- 675 N Meadows Blvd
- 680 N Tamarac Blvd Unit DD4
- 694 N Tamarac Blvd Unit CC5
- 694 N Tamarac Blvd Unit 694
- 709 N Meadows Blvd Unit U3
- 678 N Tamarac Blvd Unit DD3
- 696 N Tamarac Blvd Unit CC6