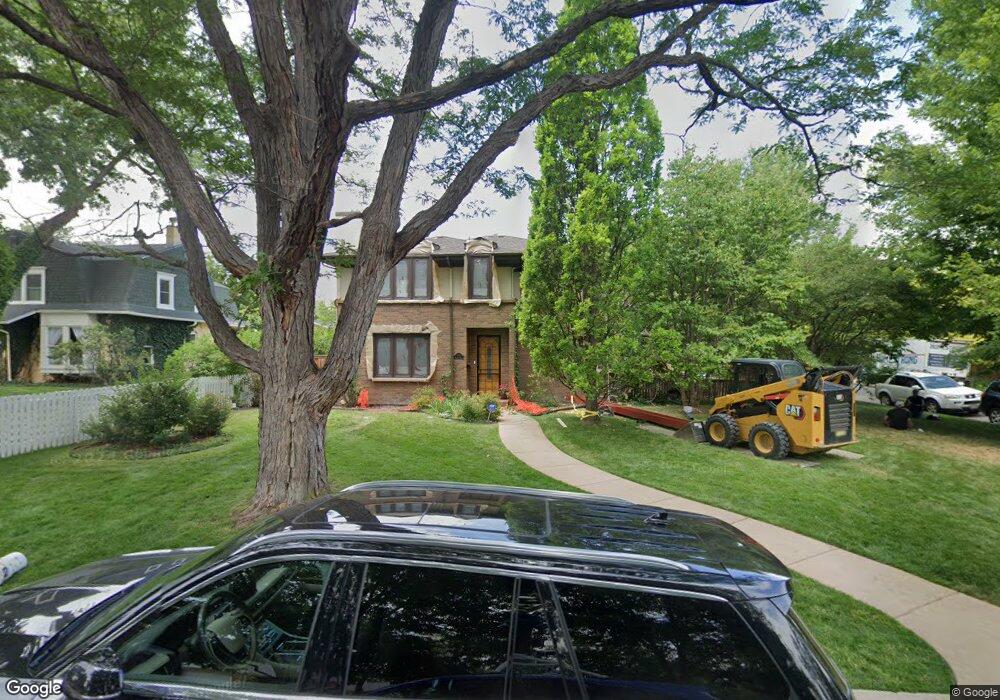
695 Niagara St Denver, CO 80220
Montclair NeighborhoodEstimated Value: $1,438,267 - $2,065,000
4
Beds
4
Baths
3,334
Sq Ft
$531/Sq Ft
Est. Value
About This Home
This home is located at 695 Niagara St, Denver, CO 80220 and is currently estimated at $1,771,067, approximately $531 per square foot. 695 Niagara St is a home located in Denver County with nearby schools including Montclair School of Academics and Enrichment, Hill Campus of Arts & Sciences, and George Washington High School.
Ownership History
Date
Name
Owned For
Owner Type
Purchase Details
Closed on
Jul 25, 2012
Sold by
Aspinwall James R and Aspinwall Diane B
Bought by
Barringer Matthew K and Barringer Betsy T
Current Estimated Value
Home Financials for this Owner
Home Financials are based on the most recent Mortgage that was taken out on this home.
Original Mortgage
$602,400
Interest Rate
3.37%
Mortgage Type
Adjustable Rate Mortgage/ARM
Purchase Details
Closed on
Nov 5, 2002
Sold by
Young John W
Bought by
Aspinwall James R and Aspinwall Diane B
Home Financials for this Owner
Home Financials are based on the most recent Mortgage that was taken out on this home.
Original Mortgage
$559,200
Interest Rate
6%
Purchase Details
Closed on
Nov 27, 2001
Sold by
Young Jeffrey R
Bought by
Young John W
Home Financials for this Owner
Home Financials are based on the most recent Mortgage that was taken out on this home.
Original Mortgage
$682,960
Interest Rate
6.39%
Purchase Details
Closed on
Mar 23, 2000
Sold by
Copeland Johnny
Bought by
Young Jeffrey R
Home Financials for this Owner
Home Financials are based on the most recent Mortgage that was taken out on this home.
Original Mortgage
$204,000
Interest Rate
8.36%
Purchase Details
Closed on
Jan 11, 2000
Sold by
Germany Betty Jean
Bought by
Copeland Johnny
Home Financials for this Owner
Home Financials are based on the most recent Mortgage that was taken out on this home.
Original Mortgage
$36,841
Interest Rate
7.86%
Mortgage Type
Unknown
Create a Home Valuation Report for This Property
The Home Valuation Report is an in-depth analysis detailing your home's value as well as a comparison with similar homes in the area
Home Values in the Area
Average Home Value in this Area
Purchase History
| Date | Buyer | Sale Price | Title Company |
|---|---|---|---|
| Barringer Matthew K | $753,000 | Land Title Guarantee Company | |
| Aspinwall James R | $699,000 | Land Title | |
| Young John W | -- | -- | |
| Young Jeffrey R | $245,000 | -- | |
| Copeland Johnny | $255,000 | -- |
Source: Public Records
Mortgage History
| Date | Status | Borrower | Loan Amount |
|---|---|---|---|
| Open | Barringer Matthew K | $1,280,000 | |
| Closed | Barringer Matthew K | $500,000 | |
| Closed | Barringer Matthew K | $551,000 | |
| Closed | Barringer Matthew K | $602,400 | |
| Closed | Barringer Matthew K | $75,300 | |
| Previous Owner | Aspinwall James P | $164,000 | |
| Previous Owner | Aspinwall James R | $25,000 | |
| Previous Owner | Aspinwall James R | $562,500 | |
| Previous Owner | Aspinwall James R | $559,200 | |
| Previous Owner | Young John W | $667,500 | |
| Previous Owner | Young John W | $682,960 | |
| Previous Owner | Young Jeffrey R | $135,650 | |
| Previous Owner | Young Jeffrey R | $365,018 | |
| Previous Owner | Young Jeffrey R | $204,000 | |
| Previous Owner | Copeland Johnny | $36,841 | |
| Previous Owner | Copeland Johnny | $204,000 | |
| Previous Owner | Germany Betty Jean | $187,000 | |
| Previous Owner | Germany Betty Jean | $136,500 | |
| Previous Owner | Germany Betty Jean | $120,000 | |
| Closed | Copeland Johnny | $26,537 |
Source: Public Records
Tax History Compared to Growth
Tax History
| Year | Tax Paid | Tax Assessment Tax Assessment Total Assessment is a certain percentage of the fair market value that is determined by local assessors to be the total taxable value of land and additions on the property. | Land | Improvement |
|---|---|---|---|---|
| 2024 | $6,653 | $84,000 | $35,280 | $48,720 |
| 2023 | $6,509 | $84,000 | $35,280 | $48,720 |
| 2022 | $6,424 | $80,780 | $37,540 | $43,240 |
| 2021 | $6,202 | $83,110 | $38,620 | $44,490 |
| 2020 | $5,906 | $79,600 | $22,280 | $57,320 |
| 2019 | $5,740 | $79,600 | $22,280 | $57,320 |
| 2018 | $5,053 | $65,310 | $20,940 | $44,370 |
| 2017 | $5,038 | $65,310 | $20,940 | $44,370 |
| 2016 | $5,533 | $67,850 | $19,844 | $48,006 |
| 2015 | $5,301 | $67,850 | $19,844 | $48,006 |
| 2014 | $3,894 | $46,880 | $11,908 | $34,972 |
Source: Public Records
Map
Nearby Homes
- 640 Magnolia St
- 791 Newport St
- 718 Locust St
- 6550 E 6th Avenue Pkwy
- 841 Niagara St
- 635 Olive St
- 7030 E 7th Ave
- 6235 E 6th Avenue Pkwy
- 463 Locust St
- 796 Pontiac St
- 1000 N Monaco Street Pkwy
- 750 Kearney St
- 852 Pontiac St
- 938 Krameria St
- 291 Magnolia St
- 903 Poplar St
- 300 Oneida St
- 1045 Locust St
- 930 Kearney St
- 1035 Leyden St
- 641 Niagara St
- 701 Niagara St
- 621 Niagara St
- 6600 E 7th Ave
- 650 Magnolia St
- 650 Niagara St
- 715 Niagara St
- 700 Magnolia St
- 656 Niagara St
- 640 Niagara St
- 630 Magnolia St
- 628 Niagara St
- 700 Niagara St
- 620 Magnolia St
- 710 Magnolia St
- 620 Niagara St
- 721 Niagara St
- 710 Niagara St
- 6633 E 6th Avenue Pkwy
- 720 Magnolia St