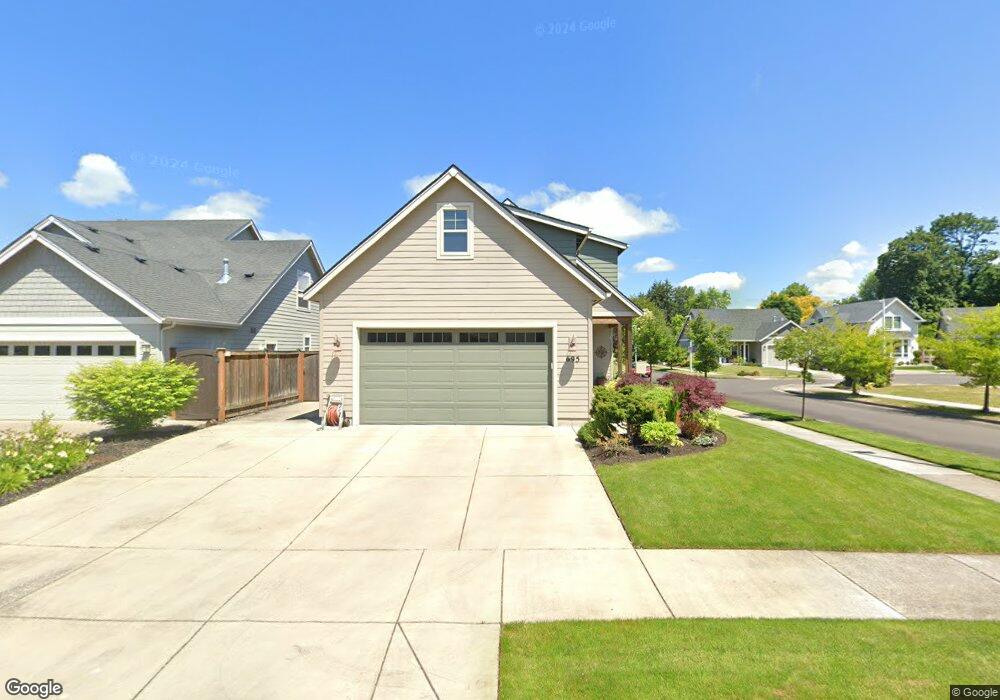
695 Watson Dr Eugene, OR 97404
Santa Clara NeighborhoodEstimated Value: $581,000 - $685,000
4
Beds
3
Baths
1,956
Sq Ft
$325/Sq Ft
Est. Value
About This Home
This home is located at 695 Watson Dr, Eugene, OR 97404 and is currently estimated at $635,307, approximately $324 per square foot. 695 Watson Dr is a home located in Lane County with nearby schools including Awbrey Park Elementary School, Madison Middle School, and North Eugene High School.
Ownership History
Date
Name
Owned For
Owner Type
Purchase Details
Closed on
Nov 23, 2016
Sold by
Peterson Timothy M
Bought by
Jones Matthew S
Current Estimated Value
Home Financials for this Owner
Home Financials are based on the most recent Mortgage that was taken out on this home.
Original Mortgage
$346,594
Outstanding Balance
$278,388
Interest Rate
3.52%
Mortgage Type
New Conventional
Estimated Equity
$356,919
Purchase Details
Closed on
Nov 22, 2016
Sold by
Jones Matthew S
Bought by
Jones Matthew S and Jones Colleen
Home Financials for this Owner
Home Financials are based on the most recent Mortgage that was taken out on this home.
Original Mortgage
$346,594
Outstanding Balance
$278,388
Interest Rate
3.52%
Mortgage Type
New Conventional
Estimated Equity
$356,919
Purchase Details
Closed on
Jul 19, 2014
Sold by
Piculell Arthur C
Bought by
Peterson Timothy M
Purchase Details
Closed on
Nov 30, 2004
Sold by
Schreckengast Jennifer
Bought by
Adams Luke
Purchase Details
Closed on
Jan 16, 2002
Sold by
Bennett Shawna Marie
Bought by
Bennett Shawna Marie and Brazil Bradley W
Purchase Details
Closed on
Mar 20, 2001
Sold by
Powers Matthew J
Bought by
Powers Matthew J and Bennett Shawna Marie
Create a Home Valuation Report for This Property
The Home Valuation Report is an in-depth analysis detailing your home's value as well as a comparison with similar homes in the area
Home Values in the Area
Average Home Value in this Area
Purchase History
| Date | Buyer | Sale Price | Title Company |
|---|---|---|---|
| Jones Matthew S | $379,900 | Cascade Title Company | |
| Jones Matthew S | $379,900 | Cascade Title Company | |
| Peterson Timothy M | $68,579 | First American Title | |
| Adams Luke | -- | -- | |
| Bennett Shawna Marie | -- | Cascade Title Company | |
| Powers Matthew J | -- | Cascade Title Co |
Source: Public Records
Mortgage History
| Date | Status | Borrower | Loan Amount |
|---|---|---|---|
| Open | Jones Matthew S | $346,594 |
Source: Public Records
Tax History
| Year | Tax Paid | Tax Assessment Tax Assessment Total Assessment is a certain percentage of the fair market value that is determined by local assessors to be the total taxable value of land and additions on the property. | Land | Improvement |
|---|---|---|---|---|
| 2025 | $7,068 | $362,780 | -- | -- |
| 2024 | $6,980 | $352,214 | -- | -- |
| 2023 | $6,980 | $341,956 | $0 | $0 |
| 2022 | $6,539 | $331,997 | $0 | $0 |
| 2021 | $6,142 | $322,328 | $0 | $0 |
| 2020 | $6,164 | $312,940 | $0 | $0 |
| 2019 | $5,953 | $303,826 | $0 | $0 |
| 2018 | $5,604 | $286,385 | $0 | $0 |
| 2017 | $5,216 | $286,385 | $0 | $0 |
| 2016 | $876 | $51,499 | $0 | $0 |
| 2015 | $858 | $49,999 | $0 | $0 |
| 2014 | $830 | $48,543 | $0 | $0 |
Source: Public Records
Map
Nearby Homes
- 528 Nottingham Ave
- 514 Warrington Ave
- 850 E Beacon Dr
- 4483 Thunderbird St
- 3910 Andover St
- 4795 Thunderbird St
- 2011 River Loop 1
- 4471 Spring Meadow Ave
- 355 River Loop 2
- 556 Cinderella Loop
- 110 Calumet Ave
- 4366 Berry Ln
- 329 Dean Ave
- 47 van Fossen Ct
- 90 Daniel Dr
- 4490 Doyle St
- 3352 Zane Ln
- 3346 Zane Ln
- 212 Chimney Rock Ln
- 3698 Revell St
- 673 Watson Dr
- 651 Watson Dr
- 4355 Wendover St
- 4344 Wendover St
- 633 Watson Dr
- 644 Watson Dr
- 660 Nottingham Ave
- 650 Nottingham Ave
- 640 Nottingham Ave
- 620 Watson Dr
- 4361 Wendover St
- 630 Nottingham Ave
- 4347 Wendover St
- 665 Edwards Dr
- 4397 Wendover St
- 617 Watson Dr
- 4339 Wendover St
- 4369 Wendover St
- 647 Edwards Dr
- 4389 Wendover St
Your Personal Tour Guide
Ask me questions while you tour the home.