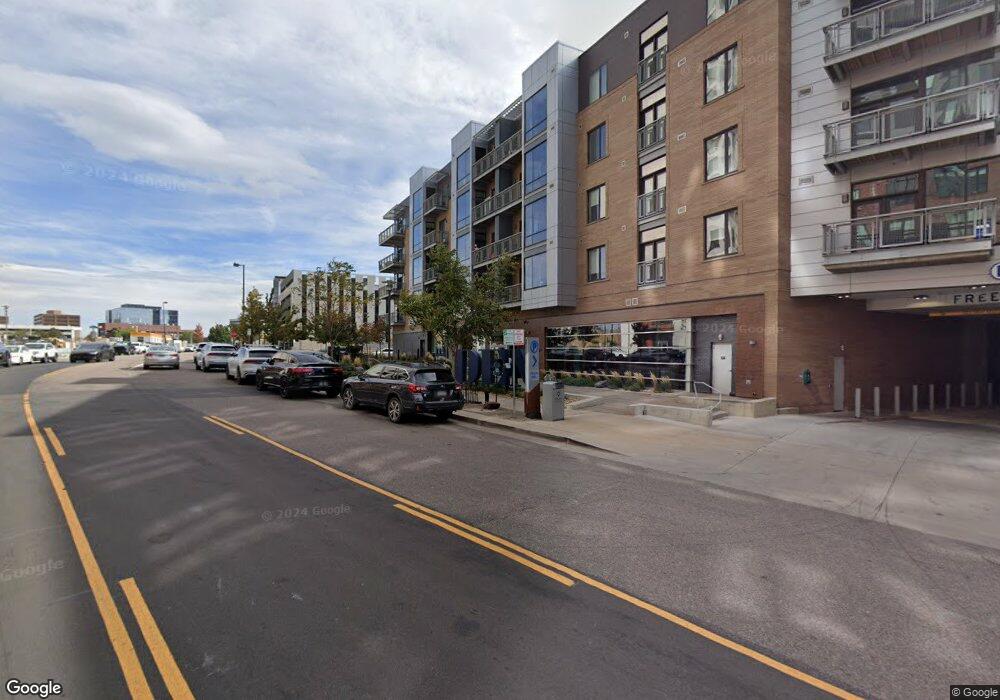
6950 E Chenango Ave Denver, CO 80237
Southmoor Park NeighborhoodEstimated Value: $204,605,456
2
Beds
1
Bath
917
Sq Ft
$223,125/Sq Ft
Est. Value
About This Home
This home is located at 6950 E Chenango Ave, Denver, CO 80237 and is currently estimated at $204,605,456, approximately $223,124 per square foot. 6950 E Chenango Ave is a home located in Denver County with nearby schools including Southmoor Elementary School, Hamilton Middle School, and Thomas Jefferson High School.
Ownership History
Date
Name
Owned For
Owner Type
Purchase Details
Closed on
Dec 18, 2017
Sold by
Nash Holland Belleview Block B Investors
Bought by
Bpp Holland Den Llc
Current Estimated Value
Home Financials for this Owner
Home Financials are based on the most recent Mortgage that was taken out on this home.
Original Mortgage
$67,200,000
Outstanding Balance
$2,435,723
Interest Rate
3.94%
Mortgage Type
Purchase Money Mortgage
Estimated Equity
$202,169,733
Create a Home Valuation Report for This Property
The Home Valuation Report is an in-depth analysis detailing your home's value as well as a comparison with similar homes in the area
Home Values in the Area
Average Home Value in this Area
Purchase History
| Date | Buyer | Sale Price | Title Company |
|---|---|---|---|
| Bpp Holland Den Llc | $112,000,000 | Chicago Title |
Source: Public Records
Mortgage History
| Date | Status | Borrower | Loan Amount |
|---|---|---|---|
| Open | Bpp Holland Den Llc | $67,200,000 |
Source: Public Records
Tax History Compared to Growth
Tax History
| Year | Tax Paid | Tax Assessment Tax Assessment Total Assessment is a certain percentage of the fair market value that is determined by local assessors to be the total taxable value of land and additions on the property. | Land | Improvement |
|---|---|---|---|---|
| 2024 | $1,320,886 | $11,772,390 | $949,670 | $10,822,720 |
| 2023 | $1,300,684 | $11,772,390 | $949,670 | $10,822,720 |
| 2022 | $1,063,226 | $9,448,800 | $787,270 | $8,661,530 |
| 2021 | $1,063,226 | $9,781,840 | $813,800 | $8,968,040 |
| 2020 | $1,123,377 | $10,479,750 | $813,800 | $9,665,950 |
| 2019 | $1,290,759 | $10,479,750 | $813,800 | $9,665,950 |
| 2018 | $1,118,543 | $8,743,810 | $817,590 | $7,926,220 |
| 2017 | $1,006,868 | $7,885,380 | $817,590 | $7,067,790 |
| 2016 | $477,179 | $3,627,440 | $729,360 | $2,898,080 |
| 2015 | $77,499 | $604,860 | $565,057 | $39,803 |
Source: Public Records
Map
Nearby Homes
- 4875 S Monaco St Unit 105
- 4885 S Monaco St Unit 208
- 6302 Charrington Dr
- 6200 Charrington Dr
- 5455 Landmark Place Unit 1116
- 5455 Landmark Place Unit 1103
- 5455 Landmark Place Unit 1411
- 5455 Landmark Place Unit 903
- 5455 Landmark Place Unit 1018
- 5455 Landmark Place Unit 509
- 5455 Landmark Place Unit 815
- 7600 Landmark Way Unit 910-2
- 7600 Landmark Way Unit 906-2
- 7600 Landmark Way Unit 1411
- 7600 Landmark Way Unit 613-2
- 7600 Landmark Way Unit 1105-2
- 7600 Landmark Way Unit 1114
- 4545 S Monaco St Unit 138
- 4545 S Monaco St Unit 324
- 4545 S Monaco St Unit 447
- 6950 E Chenango Ave
- 6950 E Chenango Ave Unit 751
- 6750 E Chenango Ave
- 6750 E Chenango Ave
- 4882 S Newport St Unit 1722
- 4882 S Newport St
- 4855 S Quebec St
- 5231 S Quebec St Unit C2
- 5231 S Quebec St
- 5241 S Quebec St
- 4811 S Niagara St Unit ID1026A
- 4811 S Niagara St Unit ID1014A
- 4811 S Niagara St Unit ID1021A
- 4811 S Niagara St Unit ID1043A
- 4811 S Niagara St Unit ID1045A
- 4811 S Niagara St Unit ID999A
- 4811 S Niagara St Unit ID1003A
- 4811 S Niagara St Unit ID992A
- 4811 S Niagara St Unit ID983A
- 4811 S Niagara St Unit ID980A