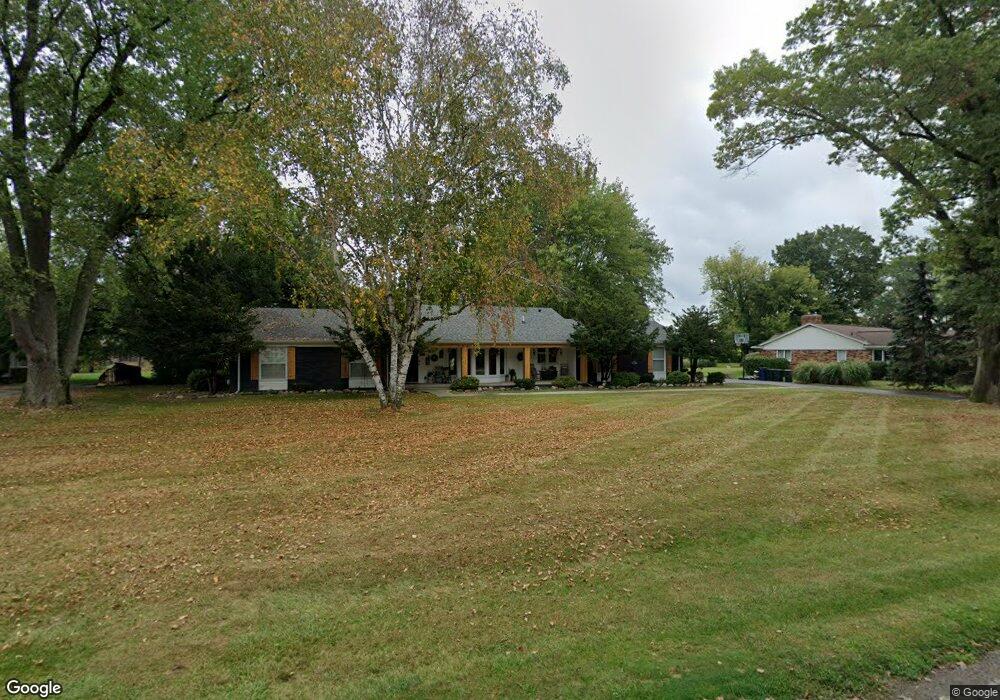
6955 Halyard Rd Bloomfield Hills, MI 48301
Estimated Value: $509,653 - $675,000
2
Beds
2
Baths
1,820
Sq Ft
$312/Sq Ft
Est. Value
About This Home
This home is located at 6955 Halyard Rd, Bloomfield Hills, MI 48301 and is currently estimated at $568,163, approximately $312 per square foot. 6955 Halyard Rd is a home located in Oakland County with nearby schools including Wylie E. Groves High School, West Maple Elementary School, and Berkshire Middle School.
Ownership History
Date
Name
Owned For
Owner Type
Purchase Details
Closed on
May 5, 2023
Sold by
Marjorie E Smith Living Trust
Bought by
Corbett Matthew and Corbett Amanda
Current Estimated Value
Home Financials for this Owner
Home Financials are based on the most recent Mortgage that was taken out on this home.
Original Mortgage
$480,290
Outstanding Balance
$466,243
Interest Rate
6.32%
Mortgage Type
FHA
Estimated Equity
$101,920
Purchase Details
Closed on
Jul 14, 2017
Sold by
Smith Marjorie E and Smith Alfred W
Bought by
Smith Majorie E and Kruis Katherine S
Purchase Details
Closed on
Sep 24, 1997
Sold by
Brune E Shegal Tr
Bought by
Smith Alfred W
Home Financials for this Owner
Home Financials are based on the most recent Mortgage that was taken out on this home.
Original Mortgage
$176,000
Interest Rate
7.54%
Purchase Details
Closed on
Jul 21, 1981
Sold by
Shegal Brune E
Bought by
Brune E Shegal Tr
Create a Home Valuation Report for This Property
The Home Valuation Report is an in-depth analysis detailing your home's value as well as a comparison with similar homes in the area
Home Values in the Area
Average Home Value in this Area
Purchase History
| Date | Buyer | Sale Price | Title Company |
|---|---|---|---|
| Corbett Matthew | $380,000 | Ata National Title | |
| Smith Majorie E | -- | None Available | |
| Smith Alfred W | $220,000 | -- | |
| Brune E Shegal Tr | -- | -- |
Source: Public Records
Mortgage History
| Date | Status | Borrower | Loan Amount |
|---|---|---|---|
| Open | Corbett Matthew | $480,290 | |
| Previous Owner | Smith Alfred W | $176,000 |
Source: Public Records
Tax History Compared to Growth
Tax History
| Year | Tax Paid | Tax Assessment Tax Assessment Total Assessment is a certain percentage of the fair market value that is determined by local assessors to be the total taxable value of land and additions on the property. | Land | Improvement |
|---|---|---|---|---|
| 2024 | $4,213 | $202,620 | $0 | $0 |
| 2023 | $2,786 | $182,640 | $0 | $0 |
| 2022 | $4,715 | $179,650 | $0 | $0 |
| 2021 | $4,754 | $171,470 | $0 | $0 |
| 2020 | $2,676 | $164,160 | $0 | $0 |
| 2019 | $4,747 | $147,040 | $0 | $0 |
| 2018 | $4,711 | $147,310 | $0 | $0 |
| 2017 | $4,708 | $144,960 | $0 | $0 |
| 2016 | $4,734 | $139,280 | $0 | $0 |
| 2015 | -- | $129,350 | $0 | $0 |
| 2014 | -- | $118,640 | $0 | $0 |
| 2011 | -- | $109,540 | $0 | $0 |
Source: Public Records
Map
Nearby Homes
- 6730 Halyard Rd
- 2014 Waldons Ct
- 6940 Castle Dr
- 7315 Lindenmere Dr
- 6720 Castle Dr
- 4647 Private Lake Dr
- 6800 N Clunbury Rd
- 7371 Lindenmere Dr
- 4665 W Maple Rd
- 6420 Apple Grove Ln Unit 10
- 27170 W 14 Mile Rd
- 7310 Sandy Creek Ln
- 32620 Inkster Rd
- 6701 Franklin Rd
- 4428 Old Trinity Ct
- 6041 Eastmoor Rd
- 25690 W 14 Mile Rd
- 7250 Ten Hill
- 4456 W Maple Rd
- 27261 Willowgreen Ct
- 6975 Halyard Rd
- 6935 Halyard Rd
- 6910 Meadowlake Rd
- 6940 Halyard Rd Unit Bldg-Unit
- 6940 Halyard Rd
- 6890 Meadowlake Rd Unit Bldg-Unit
- 6890 Meadowlake Rd
- 4811 Wye Oak Rd Unit Bldg-Unit
- 4811 Wye Oak Rd
- 6998 Meadowlake Rd
- 7056 Meadowlake Rd
- 7024 Lindenmere Dr
- 6915 Halyard Rd
- 6944 Meadowlake Rd
- 6876 Meadowlake Rd
- 6905 Meadowlake Rd
- 6925 Meadowlake Rd
- 6914 Halyard Rd
- 6895 Halyard Rd
- 7037 Meadowlake Rd