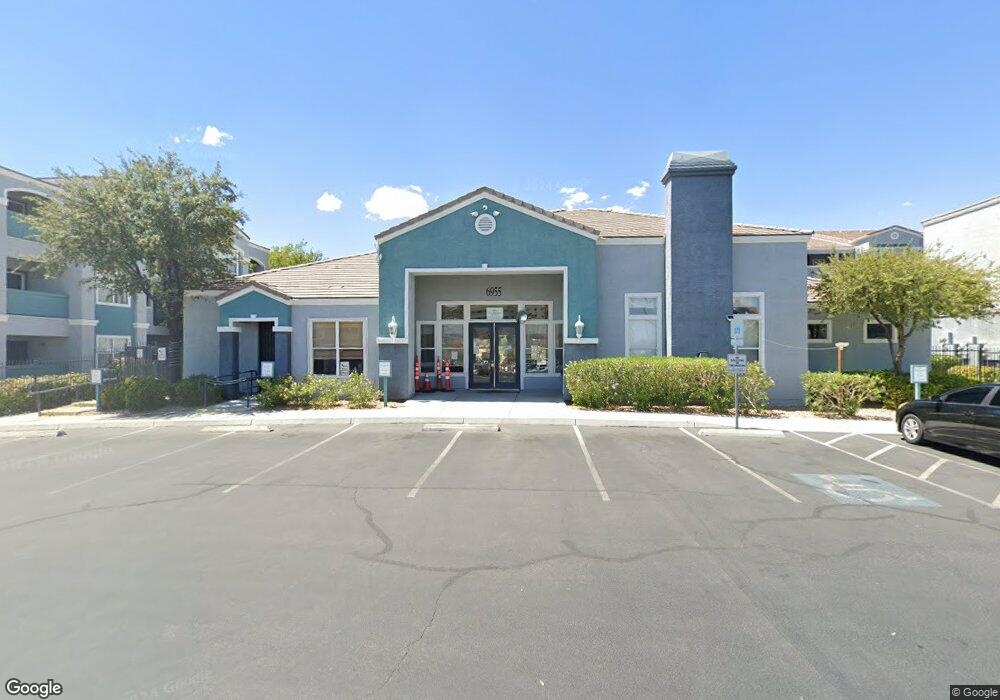
Regent at Town Center 6955 N Durango Dr Unit 1010 Las Vegas, NV 89149
Centennial Hills Town Center NeighborhoodEstimated Value: $191,000 - $205,000
1
Bed
1
Bath
700
Sq Ft
$285/Sq Ft
Est. Value
About This Home
This home is located at 6955 N Durango Dr Unit 1010, Las Vegas, NV 89149 and is currently estimated at $199,443, approximately $284 per square foot. 6955 N Durango Dr Unit 1010 is a home located in Clark County with nearby schools including Marshall C. Darnell Elementary School, Edmundo "Eddie" Escobedo, Sr. Middle School, and Centennial High School.
Ownership History
Date
Name
Owned For
Owner Type
Purchase Details
Closed on
Mar 20, 2022
Sold by
Phoenix Lv Realty Partners Llc
Bought by
Papineau Keith
Current Estimated Value
Purchase Details
Closed on
Sep 14, 2010
Sold by
Us Bank National Association
Bought by
Phoenix Lv Realty Partners Llc
Purchase Details
Closed on
Jun 9, 2010
Sold by
Hua Hoang Minh
Bought by
Us Bank National Association
Purchase Details
Closed on
Oct 14, 2005
Sold by
Le Kristy
Bought by
Hua Hoang Minh
Purchase Details
Closed on
Jun 2, 2005
Sold by
Regent Group Ii Llc
Bought by
Hua Hoang Minh
Home Financials for this Owner
Home Financials are based on the most recent Mortgage that was taken out on this home.
Original Mortgage
$74,685
Interest Rate
5.74%
Mortgage Type
Fannie Mae Freddie Mac
Create a Home Valuation Report for This Property
The Home Valuation Report is an in-depth analysis detailing your home's value as well as a comparison with similar homes in the area
Home Values in the Area
Average Home Value in this Area
Purchase History
| Date | Buyer | Sale Price | Title Company |
|---|---|---|---|
| Papineau Keith | $184,900 | New Title Company Name | |
| Phoenix Lv Realty Partners Llc | $30,000 | Chicago Title Las Vegas | |
| Us Bank National Association | $38,000 | None Available | |
| Hua Hoang Minh | -- | Fidelity National Title | |
| Hua Hoang Minh | $114,900 | Fidelity National Title |
Source: Public Records
Mortgage History
| Date | Status | Borrower | Loan Amount |
|---|---|---|---|
| Previous Owner | Hua Hoang Minh | $74,685 |
Source: Public Records
Tax History Compared to Growth
Tax History
| Year | Tax Paid | Tax Assessment Tax Assessment Total Assessment is a certain percentage of the fair market value that is determined by local assessors to be the total taxable value of land and additions on the property. | Land | Improvement |
|---|---|---|---|---|
| 2025 | $524 | $44,057 | $19,950 | $24,107 |
| 2024 | $509 | $44,057 | $19,950 | $24,107 |
| 2023 | $509 | $43,482 | $21,350 | $22,132 |
| 2022 | $495 | $37,642 | $17,150 | $20,492 |
| 2021 | $480 | $32,731 | $12,950 | $19,781 |
| 2020 | $443 | $34,341 | $14,700 | $19,641 |
| 2019 | $415 | $33,791 | $14,350 | $19,441 |
| 2018 | $396 | $26,978 | $6,300 | $20,678 |
| 2017 | $704 | $21,484 | $5,775 | $15,709 |
| 2016 | $372 | $19,447 | $5,250 | $14,197 |
| 2015 | $370 | $13,321 | $2,450 | $10,871 |
| 2014 | $359 | $10,613 | $2,450 | $8,163 |
Source: Public Records
About Regent at Town Center
Map
Nearby Homes
- 6955 N Durango Dr Unit 1041
- 6955 N Durango Dr Unit 2085
- 6955 N Durango Dr Unit 2046
- 6955 N Durango Dr Unit 1013
- 6955 N Durango Dr Unit 1038
- 6955 N Durango Dr Unit 2115
- 6955 N Durango Dr Unit 3092
- 6916 Gothic Marigold St Unit 1
- 8993 Dorrell Ln
- 9013 Townbridge Ave
- 8932 Jennifer Anne Ave
- 8925 Carter Montgomery Ave
- 8932 Paula Jean Ave
- 9004 Snowtrack Ave
- 8932 Sally Rose Ave
- 8922 Mossy Hollow Ave
- 6749 Browns Bay Ct
- 9153 Dorrell Ln
- 6864 Armistead St
- 9068 Bushy Tail Ave Unit 103
- 6955 N Durango Dr Unit 1023
- 6955 N Durango Dr Unit 1095
- 6955 N Durango Dr Unit 3014
- 6955 N Durango Dr Unit 2030
- 6955 N Durango Dr Unit 1094
- 6955 N Durango Dr Unit 3077
- 6955 N Durango Dr Unit 1029
- 6955 N Durango Dr Unit 1024
- 6955 N Durango Dr Unit 2012
- 6955 N Durango Dr Unit 2025
- 6955 N Durango Dr Unit 2048
- 6955 N Durango Dr Unit 3094
- 6955 N Durango Dr Unit 2071
- 6955 N Durango Dr Unit 1068
- 6955 N Durango Dr Unit 2095
- 6955 N Durango Dr Unit 2022
- 6955 N Durango Dr Unit 3087
- 6955 N Durango Dr Unit 2008
- 6955 N Durango Dr Unit 2017
- 6955 N Durango Dr Unit 1110