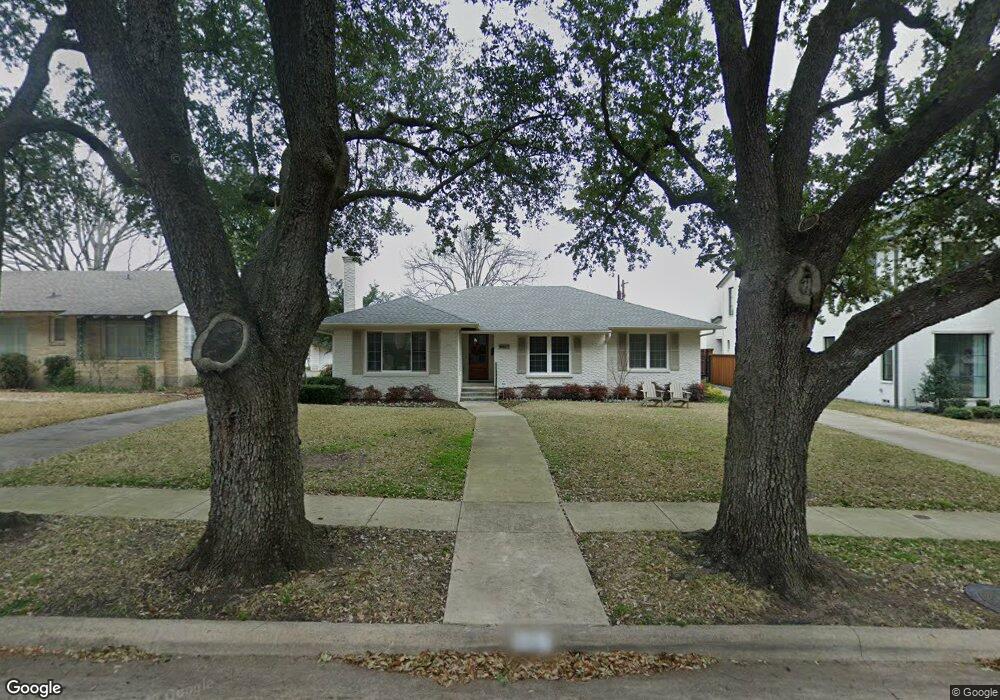
6957 Southridge Dr Dallas, TX 75214
Lakewood NeighborhoodEstimated Value: $1,185,000 - $1,346,578
3
Beds
3
Baths
2,621
Sq Ft
$495/Sq Ft
Est. Value
About This Home
This home is located at 6957 Southridge Dr, Dallas, TX 75214 and is currently estimated at $1,296,895, approximately $494 per square foot. 6957 Southridge Dr is a home located in Dallas County with nearby schools including Lakewood Elementary School, J L Long Middle School, and Woodrow Wilson High School.
Ownership History
Date
Name
Owned For
Owner Type
Purchase Details
Closed on
Mar 27, 2020
Sold by
Carothers Ashley and Carr Carothers J
Bought by
Avrea Katy Tomaszczuk and Avrea Jay Sanders
Current Estimated Value
Home Financials for this Owner
Home Financials are based on the most recent Mortgage that was taken out on this home.
Original Mortgage
$510,400
Outstanding Balance
$452,152
Interest Rate
3.4%
Mortgage Type
New Conventional
Estimated Equity
$844,743
Purchase Details
Closed on
May 24, 2012
Sold by
Acree Marian L
Bought by
Carothers J Carr and Carothers Ashley
Home Financials for this Owner
Home Financials are based on the most recent Mortgage that was taken out on this home.
Original Mortgage
$413,384
Interest Rate
3.87%
Mortgage Type
Adjustable Rate Mortgage/ARM
Purchase Details
Closed on
May 29, 2001
Sold by
Acree David B and Baird Bobbie A
Bought by
Acree Marian L
Create a Home Valuation Report for This Property
The Home Valuation Report is an in-depth analysis detailing your home's value as well as a comparison with similar homes in the area
Home Values in the Area
Average Home Value in this Area
Purchase History
| Date | Buyer | Sale Price | Title Company |
|---|---|---|---|
| Avrea Katy Tomaszczuk | -- | Rtt | |
| Carothers J Carr | -- | Ctc | |
| Acree Marian L | -- | -- |
Source: Public Records
Mortgage History
| Date | Status | Borrower | Loan Amount |
|---|---|---|---|
| Open | Avrea Katy Tomaszczuk | $510,400 | |
| Previous Owner | Carothers J Carr | $413,384 |
Source: Public Records
Tax History Compared to Growth
Tax History
| Year | Tax Paid | Tax Assessment Tax Assessment Total Assessment is a certain percentage of the fair market value that is determined by local assessors to be the total taxable value of land and additions on the property. | Land | Improvement |
|---|---|---|---|---|
| 2025 | $19,448 | $1,225,320 | $685,860 | $539,460 |
| 2024 | $19,448 | $1,225,320 | $685,860 | $539,460 |
| 2023 | $19,448 | $996,720 | $499,700 | $497,020 |
| 2022 | $24,932 | $997,130 | $470,300 | $526,830 |
| 2021 | $21,465 | $813,700 | $421,310 | $392,390 |
| 2020 | $19,171 | $706,660 | $421,310 | $285,350 |
| 2019 | $19,317 | $678,920 | $421,310 | $257,610 |
| 2018 | $17,840 | $656,060 | $411,520 | $244,540 |
| 2017 | $17,143 | $630,410 | $362,530 | $267,880 |
| 2016 | $17,143 | $630,410 | $362,530 | $267,880 |
| 2015 | $11,536 | $549,590 | $362,530 | $187,060 |
| 2014 | $11,536 | $516,250 | $244,950 | $271,300 |
Source: Public Records
Map
Nearby Homes
- 7007 Irongate Ln
- 7034 Irongate Ln
- 6905 Northridge Dr
- 6842 Merrilee Ln
- 6833 Northridge Dr
- 6814 Southridge Dr
- 3932 Frontier Ln
- 3124 Sperry St
- 7043 Delrose Dr
- 6625 Bob o Link Dr
- 4010 Sperry St
- 6932 Chantilly Ct
- 6933 Wabash Cir
- 6728 Winton St
- 6910 Wabash Cir
- 6742 Williamson Rd
- 6906 Redstart Ln
- 6757 Lakefair Cir
- 6554 Sunnyland Ln
- 6743 Sondra Dr
- 6951 Southridge Dr
- 6961 Southridge Dr
- 3605 Vintage Place
- 6945 Southridge Dr
- 6967 Southridge Dr
- 3604 Vintage Place
- 3609 Vintage Place
- 6952 Southridge Dr
- 6958 Southridge Dr
- 6946 Southridge Dr
- 6939 Southridge Dr
- 6973 Southridge Dr
- 3613 Vintage Place
- 6964 Southridge Dr
- 6940 Southridge Dr
- 3608 Vintage Place
- 6933 Southridge Dr
- 6936 Southridge Dr
- 6970 Southridge Dr
- 7003 Southridge Dr