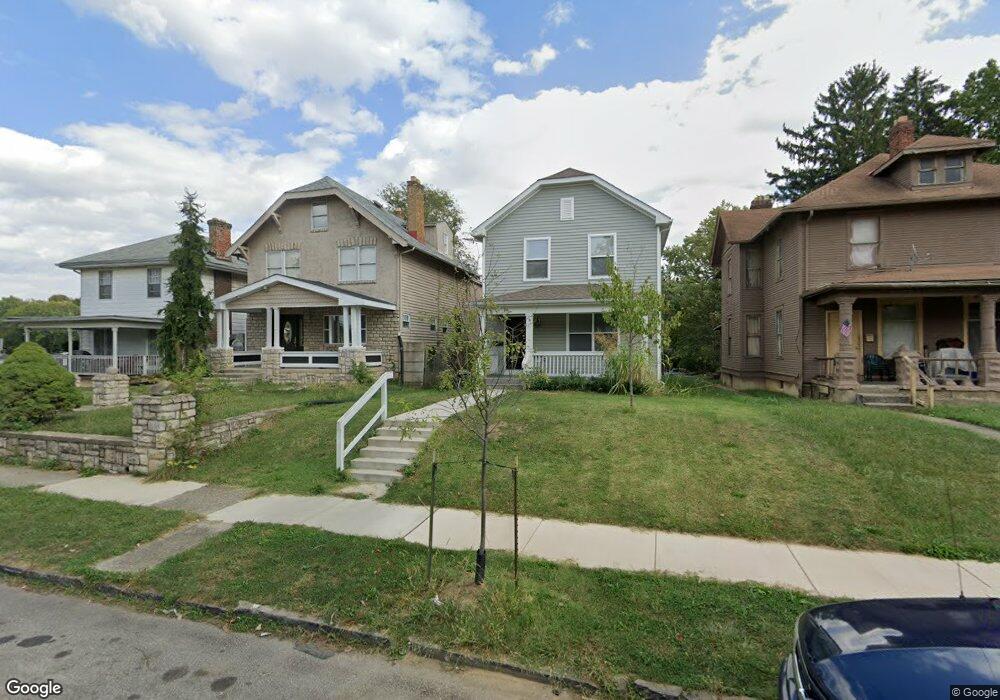
696 Berkeley Rd Unit 700 Columbus, OH 43205
Driving Park NeighborhoodEstimated Value: $242,000 - $255,227
3
Beds
3
Baths
1,452
Sq Ft
$172/Sq Ft
Est. Value
About This Home
This home is located at 696 Berkeley Rd Unit 700, Columbus, OH 43205 and is currently estimated at $249,307, approximately $171 per square foot. 696 Berkeley Rd Unit 700 is a home located in Franklin County with nearby schools including Fairwood Alternative Elementary School, South High School, and Capital Collegiate Preparatory Academy.
Ownership History
Date
Name
Owned For
Owner Type
Purchase Details
Closed on
Jun 9, 2015
Sold by
City Of Columbus
Bought by
Central Ohio Community Improvement Corp
Current Estimated Value
Purchase Details
Closed on
Feb 10, 2014
Sold by
Calloway Calvin and Leonard Edward
Bought by
City Of Columbus
Purchase Details
Closed on
Feb 7, 1997
Sold by
Anderson Warren W
Bought by
Calloway Calvin and Calloway Cheryl
Home Financials for this Owner
Home Financials are based on the most recent Mortgage that was taken out on this home.
Original Mortgage
$14,420
Interest Rate
7.73%
Mortgage Type
New Conventional
Purchase Details
Closed on
Dec 4, 1992
Purchase Details
Closed on
Sep 6, 1989
Create a Home Valuation Report for This Property
The Home Valuation Report is an in-depth analysis detailing your home's value as well as a comparison with similar homes in the area
Home Values in the Area
Average Home Value in this Area
Purchase History
| Date | Buyer | Sale Price | Title Company |
|---|---|---|---|
| Central Ohio Community Improvement Corp | -- | None Available | |
| City Of Columbus | -- | None Available | |
| Calloway Calvin | $16,000 | -- | |
| -- | $32,000 | -- | |
| -- | $5,000 | -- |
Source: Public Records
Mortgage History
| Date | Status | Borrower | Loan Amount |
|---|---|---|---|
| Previous Owner | Calloway Calvin | $14,420 |
Source: Public Records
Tax History
| Year | Tax Paid | Tax Assessment Tax Assessment Total Assessment is a certain percentage of the fair market value that is determined by local assessors to be the total taxable value of land and additions on the property. | Land | Improvement |
|---|---|---|---|---|
| 2025 | $464 | $82,150 | $10,120 | $72,030 |
| 2024 | $464 | $82,150 | $10,120 | $72,030 |
| 2023 | $647 | $82,145 | $10,115 | $72,030 |
| 2022 | $141 | $54,110 | $2,660 | $51,450 |
| 2021 | $264 | $54,110 | $2,660 | $51,450 |
| 2020 | $142 | $54,110 | $2,660 | $51,450 |
| 2019 | $131 | $43,260 | $2,100 | $41,160 |
| 2018 | $65 | $43,260 | $2,100 | $41,160 |
| 2017 | $1,219 | $19,600 | $2,100 | $17,500 |
| 2016 | $0 | $3,120 | $3,120 | $0 |
| 2015 | -- | $11,870 | $3,120 | $8,750 |
| 2014 | $814 | $11,870 | $3,120 | $8,750 |
| 2013 | $814 | $13,965 | $3,675 | $10,290 |
Source: Public Records
Map
Nearby Homes
- 688 Berkeley Rd
- 711 Seymour Ave
- 702 Seymour Ave
- 768 Berkeley Rd
- 778 Berkeley Rd
- 782 Berkeley Rd
- 0 Lilley Ave
- 623 Seymour Ave
- 604 Berkeley Rd
- 1614 E Fulton St
- 547 Berkeley Rd
- 731 Bulen Ave
- 831 Lilley Ave Unit 833
- 1472-1474 E Fulton St
- 730 Miller Ave
- 400 Miller Ave
- 544 Seymour Ave
- 522 Kelton Ave
- 518 Kelton Ave Unit 45
- 683 Miller Ave Unit 685
- 694 Berkeley Rd
- 702 Berkeley Rd Unit 704
- 704 Berkeley Rd
- 702 Berkeley Rd Unit 4
- 706 Berkeley Rd
- 1585 Mooberry St Unit 587
- 1585 Mooberry St Unit 87
- 1585-1587 Mooberry St
- 712 Berkeley Rd
- 1587 Mooberry St
- 1591 Mooberry St
- 718 Berkeley Rd
- 1595 Mooberry St
- 1580 Kent St
- 724 Berkeley Rd
- 691 Berkeley Rd
- 697 Berkeley Rd
- 1599 Mooberry St
- 1584 Kent St
- 689 Berkeley Rd
Your Personal Tour Guide
Ask me questions while you tour the home.