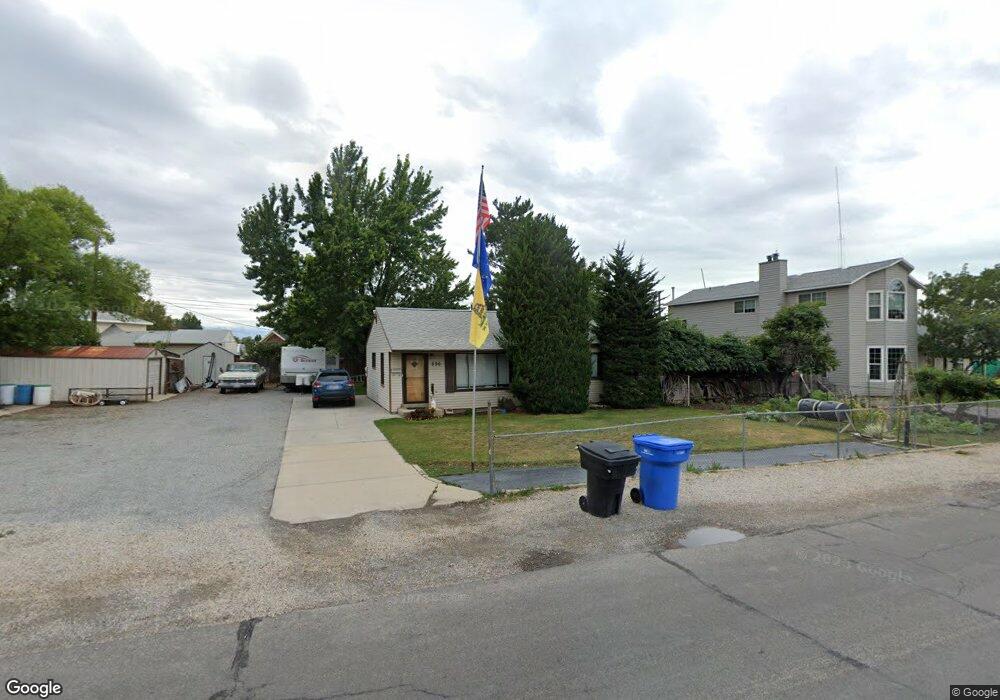
696 E 600 N Orem, UT 84097
Orchard South NeighborhoodEstimated Value: $371,562 - $391,000
2
Beds
1
Bath
864
Sq Ft
$440/Sq Ft
Est. Value
About This Home
This home is located at 696 E 600 N, Orem, UT 84097 and is currently estimated at $380,141, approximately $439 per square foot. 696 E 600 N is a home located in Utah County with nearby schools including Foothill Elementary School, Canyon View Junior High School, and Orem High School.
Ownership History
Date
Name
Owned For
Owner Type
Purchase Details
Closed on
Oct 2, 2020
Sold by
Hardman Ricky W
Bought by
Bryant Eric Joseph
Current Estimated Value
Home Financials for this Owner
Home Financials are based on the most recent Mortgage that was taken out on this home.
Original Mortgage
$246,500
Outstanding Balance
$219,249
Interest Rate
2.9%
Mortgage Type
VA
Estimated Equity
$160,892
Purchase Details
Closed on
Nov 21, 2013
Sold by
Hardman Inez W
Bought by
Hardman Ricky W
Purchase Details
Closed on
Nov 1, 2013
Sold by
Rohbock Myrna
Bought by
Hardman Inez W and The Inez W Hardman Family Living Trust
Purchase Details
Closed on
Jun 5, 2008
Sold by
Hardman Inez
Bought by
Rohbock Myrna
Create a Home Valuation Report for This Property
The Home Valuation Report is an in-depth analysis detailing your home's value as well as a comparison with similar homes in the area
Home Values in the Area
Average Home Value in this Area
Purchase History
| Date | Buyer | Sale Price | Title Company |
|---|---|---|---|
| Bryant Eric Joseph | -- | Inwest Title Services | |
| Hardman Ricky W | -- | Inwest Title Services Inc | |
| Hardman Inez W | -- | Accommodation | |
| Rohbock Myrna | -- | None Available |
Source: Public Records
Mortgage History
| Date | Status | Borrower | Loan Amount |
|---|---|---|---|
| Open | Bryant Eric Joseph | $246,500 |
Source: Public Records
Tax History
| Year | Tax Paid | Tax Assessment Tax Assessment Total Assessment is a certain percentage of the fair market value that is determined by local assessors to be the total taxable value of land and additions on the property. | Land | Improvement |
|---|---|---|---|---|
| 2025 | $1,471 | $190,245 | -- | -- |
| 2024 | $1,471 | $179,850 | $0 | $0 |
| 2023 | $1,361 | $178,805 | $0 | $0 |
| 2022 | $1,557 | $198,220 | $0 | $0 |
| 2021 | $1,416 | $273,100 | $157,800 | $115,300 |
| 2020 | $1,262 | $239,200 | $126,200 | $113,000 |
| 2019 | $1,099 | $216,600 | $118,300 | $98,300 |
| 2018 | $1,066 | $200,800 | $114,400 | $86,400 |
| 2017 | $968 | $97,680 | $0 | $0 |
| 2016 | $927 | $86,240 | $0 | $0 |
| 2015 | $877 | $77,165 | $0 | $0 |
| 2014 | $800 | $70,070 | $0 | $0 |
Source: Public Records
Map
Nearby Homes
Your Personal Tour Guide
Ask me questions while you tour the home.