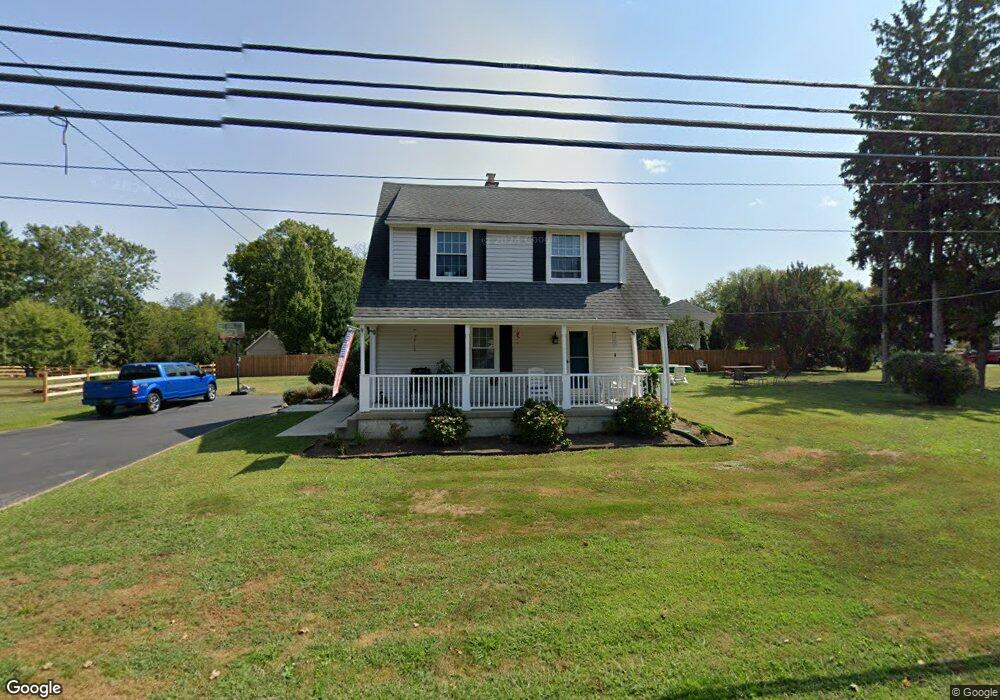
696 Lenni Rd Aston, PA 19014
Estimated Value: $417,000 - $473,085
3
Beds
2
Baths
1,721
Sq Ft
$262/Sq Ft
Est. Value
About This Home
This home is located at 696 Lenni Rd, Aston, PA 19014 and is currently estimated at $451,521, approximately $262 per square foot. 696 Lenni Rd is a home located in Delaware County with nearby schools including St. Thomas Apostle School.
Ownership History
Date
Name
Owned For
Owner Type
Purchase Details
Closed on
Nov 19, 2022
Sold by
Serine Celia D
Bought by
Ungarino Alfredo J and Ungarino Catherine A
Current Estimated Value
Home Financials for this Owner
Home Financials are based on the most recent Mortgage that was taken out on this home.
Original Mortgage
$320,000
Outstanding Balance
$312,756
Interest Rate
6.61%
Estimated Equity
$155,930
Purchase Details
Closed on
Oct 27, 2021
Sold by
Clark Shirley and Clark Robert B
Bought by
Serine Celia D and Serine Charles Kenneth
Home Financials for this Owner
Home Financials are based on the most recent Mortgage that was taken out on this home.
Original Mortgage
$296,000
Interest Rate
2.28%
Mortgage Type
New Conventional
Purchase Details
Closed on
Mar 6, 2019
Sold by
Clark Shirley
Bought by
Clark Shirley and Clark Robert B
Purchase Details
Closed on
Oct 7, 1969
Bought by
Clark Bruce R
Create a Home Valuation Report for This Property
The Home Valuation Report is an in-depth analysis detailing your home's value as well as a comparison with similar homes in the area
Home Values in the Area
Average Home Value in this Area
Purchase History
| Date | Buyer | Sale Price | Title Company |
|---|---|---|---|
| Ungarino Alfredo J | $400,000 | Trident Land Transfer | |
| Serine Celia D | $370,000 | Keystone Premier Stlmt Svcs | |
| Clark Shirley | -- | None Available | |
| Clark Bruce R | -- | -- |
Source: Public Records
Mortgage History
| Date | Status | Borrower | Loan Amount |
|---|---|---|---|
| Open | Ungarino Alfredo J | $320,000 | |
| Previous Owner | Serine Celia D | $296,000 | |
| Previous Owner | Clark Shirley | $99,609 | |
| Previous Owner | Clark Robert B | $80,000 |
Source: Public Records
Tax History Compared to Growth
Tax History
| Year | Tax Paid | Tax Assessment Tax Assessment Total Assessment is a certain percentage of the fair market value that is determined by local assessors to be the total taxable value of land and additions on the property. | Land | Improvement |
|---|---|---|---|---|
| 2024 | $6,986 | $269,220 | $103,010 | $166,210 |
| 2023 | $6,673 | $269,220 | $103,010 | $166,210 |
| 2022 | $6,434 | $269,220 | $103,010 | $166,210 |
| 2021 | $9,930 | $269,220 | $103,010 | $166,210 |
| 2020 | $5,807 | $142,190 | $61,650 | $80,540 |
| 2019 | $5,696 | $142,190 | $61,650 | $80,540 |
| 2018 | $5,454 | $142,190 | $0 | $0 |
| 2017 | $5,338 | $142,190 | $0 | $0 |
| 2016 | $780 | $142,190 | $0 | $0 |
| 2015 | $796 | $142,190 | $0 | $0 |
| 2014 | $780 | $142,190 | $0 | $0 |
Source: Public Records
Map
Nearby Homes
- 384 Lenni Rd
- 346 Lenni Rd
- 20 Bishop Dr
- 48 Bishop Dr
- 38 New Rd
- 324 Crozerville Rd
- 324 332 Crozerville Rd
- 239 Bishop Dr
- 505 Station Rd
- 31 Hoag Ln
- 214 Bishop Dr
- 229 Valleybrook Rd
- 2630 Mount Rd
- 4621 Aston Mills Rd
- 277 W Baltimore Pike
- 103 Valleybrook Rd
- 783 Hill Ave
- 131 Junction Rd
- 21 Eusden Dr
- 302 Wexford Ct Unit 302
- 696 Lenni Rd
- 696 Lenni Rd
- 696 Lenni Rd
- 2280 Lenni Rd
- 1515 Springhill Dr
- 1515 Springhill Dr
- 696A Lenni Rd
- 2 Rolling Heights Ln
- 1525 Springhill Dr
- 2300 Lenni Rd
- 1510 Springhill Dr
- 1 Rolling Heights Ln
- 1535 Springhill Dr
- 4 Rolling Heights Ln
- 1575 Springhill Dr
- 1520 Springhill Dr
- 695 Lenni Rd
- 694 Lenni Rd
- 1585 Springhill Dr
- 1530 Sickles Dr