696 Misty Hammock Dr Murrells Inlet, SC 29576
Burgess NeighborhoodEstimated Value: $366,966 - $382,000
3
Beds
2
Baths
1,925
Sq Ft
$195/Sq Ft
Est. Value
About This Home
This home is located at 696 Misty Hammock Dr, Murrells Inlet, SC 29576 and is currently estimated at $375,492, approximately $195 per square foot. 696 Misty Hammock Dr is a home located in Horry County with nearby schools including St. James Elementary School, St. James Middle School, and St. James Intermediate.
Ownership History
Date
Name
Owned For
Owner Type
Purchase Details
Closed on
Feb 13, 2019
Sold by
Haynes Anita D
Bought by
Haynes Anita D and Lauderback Carole S
Current Estimated Value
Home Financials for this Owner
Home Financials are based on the most recent Mortgage that was taken out on this home.
Original Mortgage
$50,000
Outstanding Balance
$31,934
Interest Rate
4.6%
Mortgage Type
New Conventional
Estimated Equity
$343,558
Purchase Details
Closed on
Jan 14, 2019
Sold by
Specht Kenneth Brian
Bought by
Haynes Anita D
Home Financials for this Owner
Home Financials are based on the most recent Mortgage that was taken out on this home.
Original Mortgage
$50,000
Outstanding Balance
$31,934
Interest Rate
4.6%
Mortgage Type
New Conventional
Estimated Equity
$343,558
Purchase Details
Closed on
May 16, 2017
Sold by
Worley
Bought by
Specht Kenneth Brian and Specht Delmar Keith
Purchase Details
Closed on
Feb 11, 2015
Sold by
Pagnotta Alexander and Pagnotta Linda C
Bought by
Worley Frances A
Purchase Details
Closed on
Aug 13, 2008
Sold by
Johns Bay South Llc
Bought by
Pagnotta Alexander
Create a Home Valuation Report for This Property
The Home Valuation Report is an in-depth analysis detailing your home's value as well as a comparison with similar homes in the area
Home Values in the Area
Average Home Value in this Area
Purchase History
| Date | Buyer | Sale Price | Title Company |
|---|---|---|---|
| Haynes Anita D | -- | -- | |
| Haynes Anita D | $215,000 | -- | |
| Specht Kenneth Brian | $190,000 | -- | |
| Worley Frances A | $172,000 | -- | |
| Pagnotta Alexander | $161,390 | -- |
Source: Public Records
Mortgage History
| Date | Status | Borrower | Loan Amount |
|---|---|---|---|
| Open | Haynes Anita D | $50,000 |
Source: Public Records
Tax History Compared to Growth
Tax History
| Year | Tax Paid | Tax Assessment Tax Assessment Total Assessment is a certain percentage of the fair market value that is determined by local assessors to be the total taxable value of land and additions on the property. | Land | Improvement |
|---|---|---|---|---|
| 2024 | $1,055 | $14,282 | $4,400 | $9,882 |
| 2023 | $1,055 | $8,544 | $1,664 | $6,880 |
| 2021 | $823 | $8,544 | $1,664 | $6,880 |
| 2020 | $731 | $8,544 | $1,664 | $6,880 |
| 2019 | $731 | $8,544 | $1,664 | $6,880 |
| 2018 | $0 | $11,160 | $2,010 | $9,150 |
| 2017 | $589 | $10,182 | $2,010 | $8,172 |
| 2016 | $0 | $6,788 | $1,340 | $5,448 |
| 2015 | -- | $6,788 | $1,340 | $5,448 |
| 2014 | $2,007 | $10,182 | $2,010 | $8,172 |
Source: Public Records
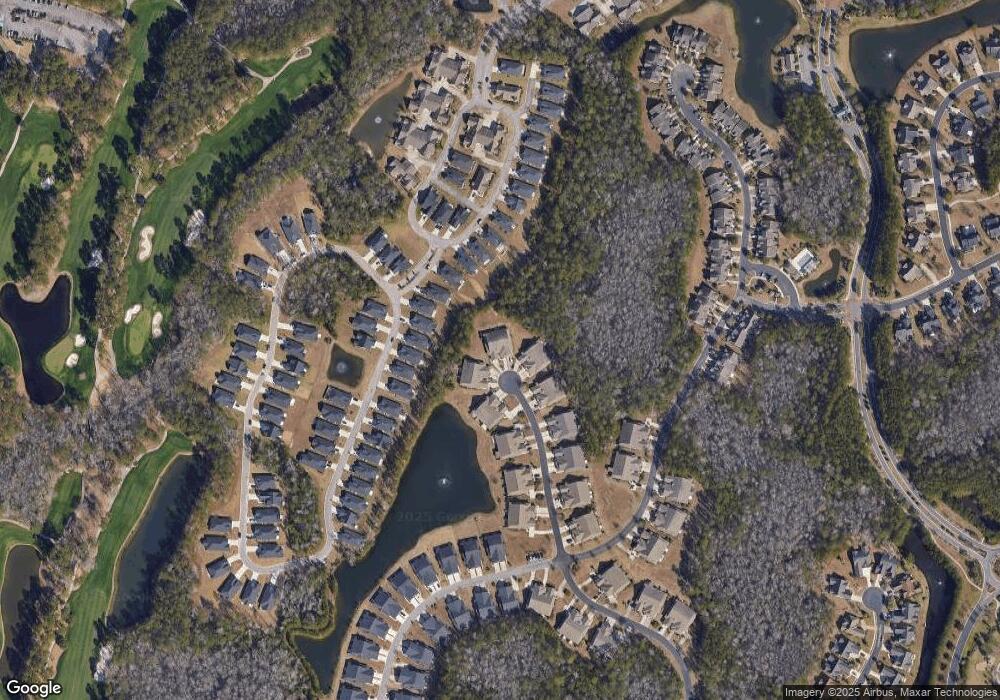
Map
Nearby Homes
- 641 Botany Loop Unit 63
- 348 Arlington Cir Unit 348
- 570 Botany Loop Unit 570
- 168 Stonegate Blvd Unit 168
- 297 Bent Green Ct Unit 76A
- 269 Bent Green Ct Unit 76H
- 160 Stonegate Blvd Unit 160
- 289 Bent Green Ct Unit 76C
- 293 Bent Green Ct Unit 76B
- 277 Bent Green Ct Unit 76F
- 285 Bent Green Ct Unit 76D
- 281 Bent Green Ct Unit 76E
- 532 Ryegrass Way Unit 29B
- 273 Bent Green Ct Unit 76G
- 482 Botany Loop Unit 155
- 204 Willow Bay Dr
- 127 Willow Bay Dr Unit Willow Bay
- 117 Willow Bay Dr
- 545 Ryegrass Way Unit 14A
- 105 Willow Bay Dr
- 696 Misty Hammock Dr Unit JOHN'S BAY PH II; LO
- 696 Misty Hammock Dr Unit 696
- 692 Misty Hammock Dr
- 692 Misty Hammock Dr Unit 84C
- 700 Misty Hammock Dr
- 699 Misty Hammock Dr Unit Lot 87
- 699 Misty Hammock Dr Unit 699 Misty Hammock Dr
- 699 Misty Hammock Dr
- 688 Misty Hammock Dr
- 684 Misty Hammock Dr Unit 82-B JOHNS BAY SOUT
- 684 Misty Hammock Dr
- 695 Misty Hammock Dr
- 691 Misty Hammock Dr
- 680 Misty Hammock Dr Unit 680 Johns Bay South
- 680 Misty Hammock Dr
- 680 Misty Hammock Dr Unit Lot 81
- 672 Misty Hammock Dr Unit John's Bay South
- 672 Misty Hammock Dr Unit 672 Johns Bay South
- 672 Misty Hammock Dr
- 687 Misty Hammock Dr