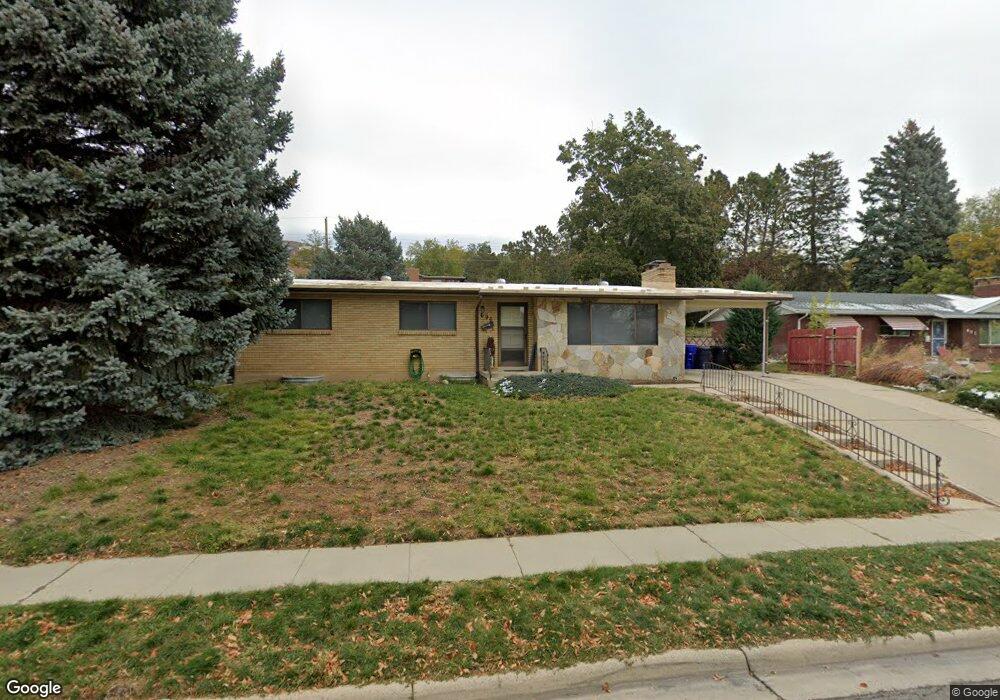
696 N 800 E Bountiful, UT 84010
Estimated Value: $512,000 - $636,000
4
Beds
3
Baths
1,208
Sq Ft
$461/Sq Ft
Est. Value
About This Home
This home is located at 696 N 800 E, Bountiful, UT 84010 and is currently estimated at $556,345, approximately $460 per square foot. 696 N 800 E is a home located in Davis County with nearby schools including Holbrook Elementary School, Bountiful Junior High School, and Bountiful High School.
Ownership History
Date
Name
Owned For
Owner Type
Purchase Details
Closed on
Sep 2, 2021
Sold by
Blaser Benjamin
Bought by
Blaser Benjamin J and Blaser Christie A
Current Estimated Value
Home Financials for this Owner
Home Financials are based on the most recent Mortgage that was taken out on this home.
Original Mortgage
$318,750
Outstanding Balance
$289,712
Interest Rate
2.87%
Estimated Equity
$266,633
Purchase Details
Closed on
May 28, 2021
Sold by
Seblaser Llc
Bought by
Blaser Benjamin
Home Financials for this Owner
Home Financials are based on the most recent Mortgage that was taken out on this home.
Original Mortgage
$404,051
Interest Rate
2.9%
Mortgage Type
Commercial
Purchase Details
Closed on
Mar 22, 2021
Sold by
Godfrey Frank R and Godfrey Family Trust
Bought by
Sebiaser Llc
Purchase Details
Closed on
Jan 19, 1996
Sold by
Godfrey Frank R
Bought by
Godfrey Frank R and The Godfrey Family Trust
Create a Home Valuation Report for This Property
The Home Valuation Report is an in-depth analysis detailing your home's value as well as a comparison with similar homes in the area
Purchase History
| Date | Buyer | Sale Price | Title Company |
|---|---|---|---|
| Blaser Benjamin J | -- | North American Title | |
| Blaser Benjamin | -- | North American Title | |
| Sebiaser Llc | -- | North American Tit | |
| Godfrey Frank R | -- | -- |
Source: Public Records
Mortgage History
| Date | Status | Borrower | Loan Amount |
|---|---|---|---|
| Open | Blaser Benjamin J | $318,750 | |
| Closed | Blaser Benjamin | $404,051 |
Source: Public Records
Tax History
| Year | Tax Paid | Tax Assessment Tax Assessment Total Assessment is a certain percentage of the fair market value that is determined by local assessors to be the total taxable value of land and additions on the property. | Land | Improvement |
|---|---|---|---|---|
| 2025 | $2,935 | $261,800 | $142,330 | $119,470 |
| 2024 | $2,892 | $255,199 | $131,093 | $124,106 |
| 2023 | $2,639 | $244,200 | $131,703 | $112,497 |
| 2022 | $2,791 | $470,000 | $232,285 | $237,715 |
| 2021 | $2,408 | $340,000 | $190,034 | $149,966 |
| 2020 | $2,131 | $301,000 | $172,997 | $128,003 |
| 2019 | $2,158 | $298,000 | $166,512 | $131,488 |
| 2018 | $2,006 | $272,000 | $155,205 | $116,795 |
| 2016 | $1,765 | $129,800 | $51,148 | $78,652 |
| 2015 | $1,723 | $119,460 | $51,148 | $68,312 |
| 2014 | $1,758 | $126,042 | $51,148 | $74,894 |
| 2013 | -- | $105,031 | $44,319 | $60,712 |
Source: Public Records
Map
Nearby Homes
- 749 E 400 N
- 908 Northern Hills Dr Unit 3
- 644 Crestwood Cir
- 933 Northern Hills Cir
- 129 N 800 E
- 683 E 100 N
- 513 N 400 E Unit 14B
- 6 N 800 E
- 282 E 650 N
- 15 W Orchard Ln
- 978 N 170 E
- 698 E 200 S
- 1440 Northridge Dr
- 214 E 1250 N
- 1342 E Skyline Dr N Unit 30
- 17 E 400 N Unit 19B
- 49 E 200 N Unit 4
- 41 E 200 N Unit 6
- 55 E 200 N Unit 2
- 51 E 200 N Unit 3
Your Personal Tour Guide
Ask me questions while you tour the home.