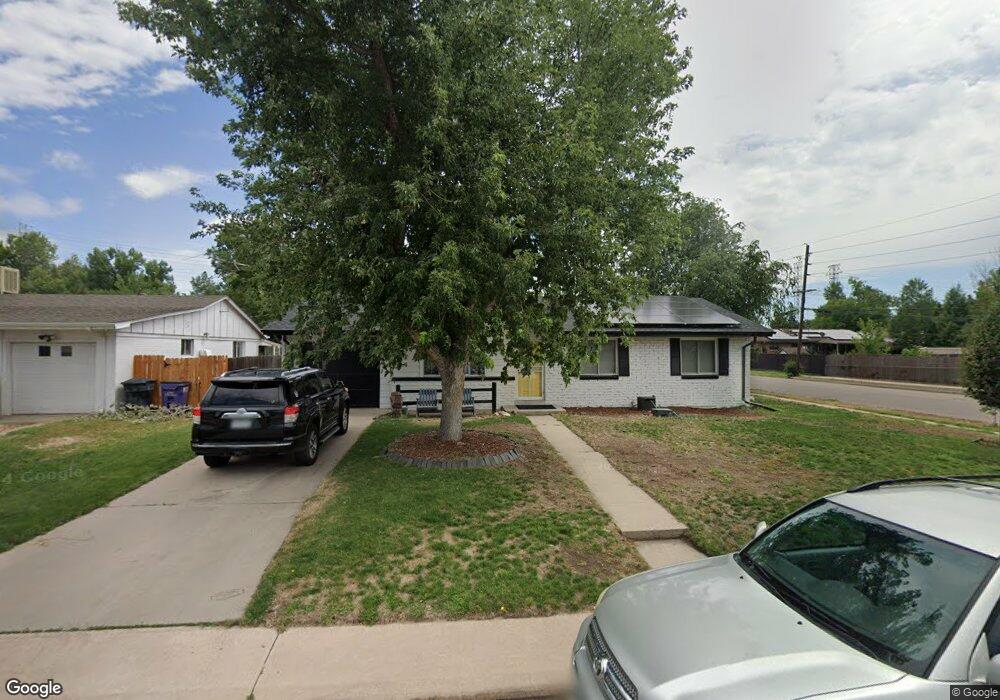
696 S Jersey St Denver, CO 80224
Washington Virginia Vale NeighborhoodEstimated Value: $598,639 - $746,000
4
Beds
3
Baths
2,572
Sq Ft
$254/Sq Ft
Est. Value
About This Home
This home is located at 696 S Jersey St, Denver, CO 80224 and is currently estimated at $652,910, approximately $253 per square foot. 696 S Jersey St is a home located in Denver County with nearby schools including McMeen Elementary School, Hill Campus of Arts & Sciences, and George Washington High School.
Ownership History
Date
Name
Owned For
Owner Type
Purchase Details
Closed on
Nov 21, 2013
Sold by
Shippey Hannah L and Heuss John L
Bought by
Nielsen Eric Richard and Farritor Jacqueline Stephanie
Current Estimated Value
Home Financials for this Owner
Home Financials are based on the most recent Mortgage that was taken out on this home.
Original Mortgage
$260,929
Outstanding Balance
$195,050
Interest Rate
4.29%
Mortgage Type
New Conventional
Estimated Equity
$457,860
Purchase Details
Closed on
Feb 6, 2008
Sold by
Hobbins Susan H and Shippey Hannah L
Bought by
Shippey Hannah L and Heuss John L
Home Financials for this Owner
Home Financials are based on the most recent Mortgage that was taken out on this home.
Original Mortgage
$225,025
Interest Rate
6.07%
Mortgage Type
New Conventional
Purchase Details
Closed on
Jan 5, 2007
Sold by
The Helen B Power Trust
Bought by
Hobbins Susan H and Shippey Hannah L
Purchase Details
Closed on
Feb 9, 2000
Sold by
Bahlay Helen S
Bought by
The Helen B Power Trust
Create a Home Valuation Report for This Property
The Home Valuation Report is an in-depth analysis detailing your home's value as well as a comparison with similar homes in the area
Home Values in the Area
Average Home Value in this Area
Purchase History
| Date | Buyer | Sale Price | Title Company |
|---|---|---|---|
| Nielsen Eric Richard | $269,000 | Fidelity National Title Insu | |
| Shippey Hannah L | -- | Fita | |
| Hobbins Susan H | $255,000 | Guardian Title | |
| The Helen B Power Trust | -- | -- |
Source: Public Records
Mortgage History
| Date | Status | Borrower | Loan Amount |
|---|---|---|---|
| Open | Nielsen Eric Richard | $260,929 | |
| Previous Owner | Shippey Hannah L | $225,025 |
Source: Public Records
Tax History Compared to Growth
Tax History
| Year | Tax Paid | Tax Assessment Tax Assessment Total Assessment is a certain percentage of the fair market value that is determined by local assessors to be the total taxable value of land and additions on the property. | Land | Improvement |
|---|---|---|---|---|
| 2024 | $2,868 | $36,210 | $11,380 | $24,830 |
| 2023 | $2,806 | $36,210 | $11,380 | $24,830 |
| 2022 | $2,416 | $30,380 | $15,630 | $14,750 |
| 2021 | $2,333 | $31,260 | $16,080 | $15,180 |
| 2020 | $2,082 | $28,060 | $16,080 | $11,980 |
| 2019 | $2,024 | $28,060 | $16,080 | $11,980 |
| 2018 | $1,918 | $24,790 | $7,560 | $17,230 |
| 2017 | $1,912 | $24,790 | $7,560 | $17,230 |
| 2016 | $1,908 | $23,400 | $7,164 | $16,236 |
| 2015 | $1,828 | $23,400 | $7,164 | $16,236 |
| 2014 | $1,659 | $19,980 | $7,164 | $12,816 |
Source: Public Records
Map
Nearby Homes
- 715 S Krameria St Unit 715/725
- 691 S Holly St
- 765 S Krameria St
- 812 S Holly St
- 5593 E Center Ave
- 5502 E Center Ave
- 800 S Krameria St
- 778 S Leyden St
- 786 S Leyden St
- 783 S Locust St
- 857 S Leyden St
- 894 S Krameria St
- 936 S Jersey St
- 444 S Jersey St
- 745 S Glencoe St
- 488 S Leyden St
- 986 S Jersey St
- 867 S Grape St
- 540 S Forest St Unit 3-204
- 540 S Forest St Unit 1-104
- 686 S Jersey St
- 706 S Jersey St
- 697 S Jasmine Way
- 676 S Jersey St
- 687 S Jasmine Way
- 695 S Jersey St
- 685 S Jersey St
- 707 S Jasmine St
- 677 S Jasmine Way
- 716 S Jersey St
- 705 S Jersey St
- 656 S Jersey St
- 675 S Jersey St
- 717 S Jasmine St
- 715 S Jersey St
- 657 S Jasmine Way
- 655 S Jersey St
- 726 S Jersey St
- 636 S Jersey St
- 688 S Jasmine Way