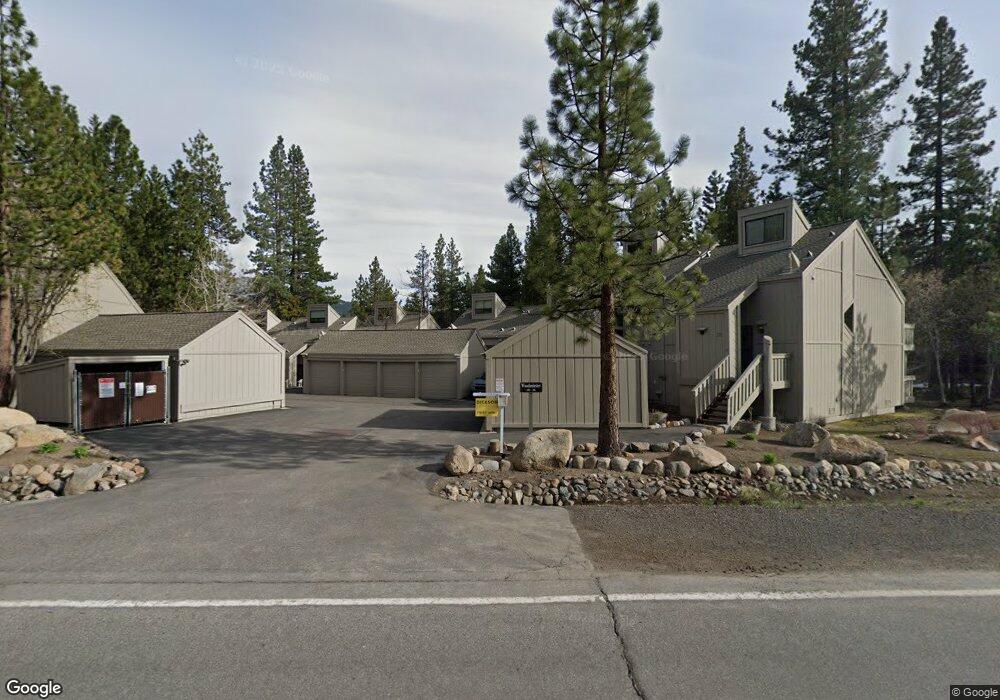
696 Village Blvd Incline Village, NV 89451
Estimated Value: $953,000 - $1,069,000
2
Beds
2
Baths
1,672
Sq Ft
$603/Sq Ft
Est. Value
About This Home
This home is located at 696 Village Blvd, Incline Village, NV 89451 and is currently estimated at $1,009,037, approximately $603 per square foot. 696 Village Blvd is a home located in Washoe County with nearby schools including Incline Elementary School, Incline Middle School, and Incline High School.
Ownership History
Date
Name
Owned For
Owner Type
Purchase Details
Closed on
Sep 25, 2020
Sold by
Wakefield James A and Wakefield Sherry Bell
Bought by
Bottarini Donald R and Bottarini Marisa
Current Estimated Value
Home Financials for this Owner
Home Financials are based on the most recent Mortgage that was taken out on this home.
Original Mortgage
$510,000
Outstanding Balance
$453,618
Interest Rate
2.9%
Mortgage Type
New Conventional
Estimated Equity
$555,419
Purchase Details
Closed on
May 20, 2015
Sold by
Village Blvd 27 Series Of The Renovation
Bought by
Bell Wakefield James A and Bell Wakefield Sherry
Home Financials for this Owner
Home Financials are based on the most recent Mortgage that was taken out on this home.
Original Mortgage
$380,000
Interest Rate
3.97%
Mortgage Type
New Conventional
Purchase Details
Closed on
Sep 30, 2014
Sold by
Berg Bryan J and Berg Pamela I
Bought by
Village Blvd 27 Series Of The Renovation
Purchase Details
Closed on
Sep 16, 2014
Sold by
Berg Bryan J
Bought by
Bryan Berg Living Trust
Purchase Details
Closed on
Sep 26, 2013
Sold by
Johnson Pamela
Bought by
Berg Bryan
Home Financials for this Owner
Home Financials are based on the most recent Mortgage that was taken out on this home.
Original Mortgage
$210,000
Interest Rate
4.57%
Mortgage Type
New Conventional
Purchase Details
Closed on
Mar 11, 2013
Sold by
Quinlen John I and Quinlen Betty J
Bought by
Berg Bryan J and Bryan Berg Living Trust
Purchase Details
Closed on
Jun 3, 2009
Sold by
Martin Peter F and Martin Vanda F
Bought by
Quinlen John I and Quinlen Betty J
Home Financials for this Owner
Home Financials are based on the most recent Mortgage that was taken out on this home.
Original Mortgage
$310,500
Interest Rate
4.87%
Mortgage Type
Unknown
Purchase Details
Closed on
Aug 21, 2002
Sold by
Martin Peter F and Martin Vanda F
Bought by
Martin Peter F and Martin Vanda F
Home Financials for this Owner
Home Financials are based on the most recent Mortgage that was taken out on this home.
Original Mortgage
$300,000
Interest Rate
6.71%
Purchase Details
Closed on
Jul 2, 2002
Sold by
Fike William T and Fike Carol L
Bought by
Martin Peter F and Martin Vanda F
Home Financials for this Owner
Home Financials are based on the most recent Mortgage that was taken out on this home.
Original Mortgage
$300,000
Interest Rate
6.71%
Purchase Details
Closed on
Jul 21, 2000
Sold by
Fike William T and Fike Carol L
Bought by
Fike William T and Fike Carol L
Create a Home Valuation Report for This Property
The Home Valuation Report is an in-depth analysis detailing your home's value as well as a comparison with similar homes in the area
Home Values in the Area
Average Home Value in this Area
Purchase History
| Date | Buyer | Sale Price | Title Company |
|---|---|---|---|
| Bottarini Donald R | $725,000 | Ticor Title Incline Village | |
| Bell Wakefield James A | $475,000 | First Centennial Reno | |
| Village Blvd 27 Series Of The Renovation | -- | None Available | |
| Bryan Berg Living Trust | -- | None Available | |
| Berg Bryan | -- | Ticor Title Reno | |
| Berg Bryan | -- | Ticor Title Reno | |
| Berg Bryan J | $410,000 | First American Title Iv | |
| Quinlen John I | $414,000 | First Centennial Reno | |
| Martin Peter F | -- | -- | |
| Martin Peter F | $375,000 | First American Title Co | |
| Fike William T | -- | -- |
Source: Public Records
Mortgage History
| Date | Status | Borrower | Loan Amount |
|---|---|---|---|
| Open | Bottarini Donald R | $510,000 | |
| Previous Owner | Bell Wakefield James A | $380,000 | |
| Previous Owner | Berg Bryan | $210,000 | |
| Previous Owner | Quinlen John I | $310,500 | |
| Previous Owner | Martin Peter F | $300,000 |
Source: Public Records
Tax History Compared to Growth
Tax History
| Year | Tax Paid | Tax Assessment Tax Assessment Total Assessment is a certain percentage of the fair market value that is determined by local assessors to be the total taxable value of land and additions on the property. | Land | Improvement |
|---|---|---|---|---|
| 2025 | $2,909 | $122,804 | $80,220 | $42,585 |
| 2024 | $2,909 | $112,780 | $67,655 | $45,125 |
| 2023 | $2,131 | $108,306 | $67,655 | $40,651 |
| 2022 | $3,098 | $89,867 | $52,045 | $37,822 |
| 2021 | $3,031 | $75,433 | $37,170 | $38,263 |
| 2020 | $3,013 | $76,440 | $37,730 | $38,710 |
| 2019 | $2,950 | $72,764 | $34,860 | $37,904 |
| 2018 | $2,888 | $64,379 | $27,020 | $37,359 |
| 2017 | $2,828 | $61,478 | $24,360 | $37,118 |
| 2016 | $2,778 | $59,714 | $21,525 | $38,189 |
| 2015 | $2,773 | $56,232 | $19,285 | $36,947 |
| 2014 | $2,751 | $55,762 | $18,375 | $37,387 |
| 2013 | -- | $55,131 | $17,465 | $37,666 |
Source: Public Records
Map
Nearby Homes
- 696 Village Blvd Unit 24
- 696 Village Blvd Unit 12
- 696 Village Blvd Unit 20
- 978 Glenrock Dr Unit 45
- 978 Glenrock Dr Unit 13
- 898 Peepsight Cir Unit 27B
- 654 Country Club Dr
- 647 Village Blvd Unit 3
- 770 Golfers Pass Rd
- 976 Caddie Ct
- 725 Fairview Blvd Unit 11
- 725 Fairview Blvd Unit 40
- 844 Lichen Ct
- 577 Eagle Dr
- 575 Fairview Blvd
- 779 Rosewood Cir
- 757 Champagne Rd
- 708 Champagne Rd
- 517 Driver Way
- 585 Village Blvd
- 696 Village Blvd Unit 2
- 696 Village Blvd Unit 36
- 696 Village Blvd Unit 28
- 696 Village Blvd
- 696 Village Blvd
- 696 Village Blvd
- 696 Village Blvd
- 696 Village Blvd
- 696 Village Blvd
- 696 Village Blvd
- 696 Village Blvd
- 696 Village Blvd
- 696 Village Blvd
- 696 Village Blvd
- 696 Village Blvd
- 696 Village Blvd
- 696 Village Blvd
- 696 Village Blvd
- 696 Village Blvd
- 696 Village Blvd