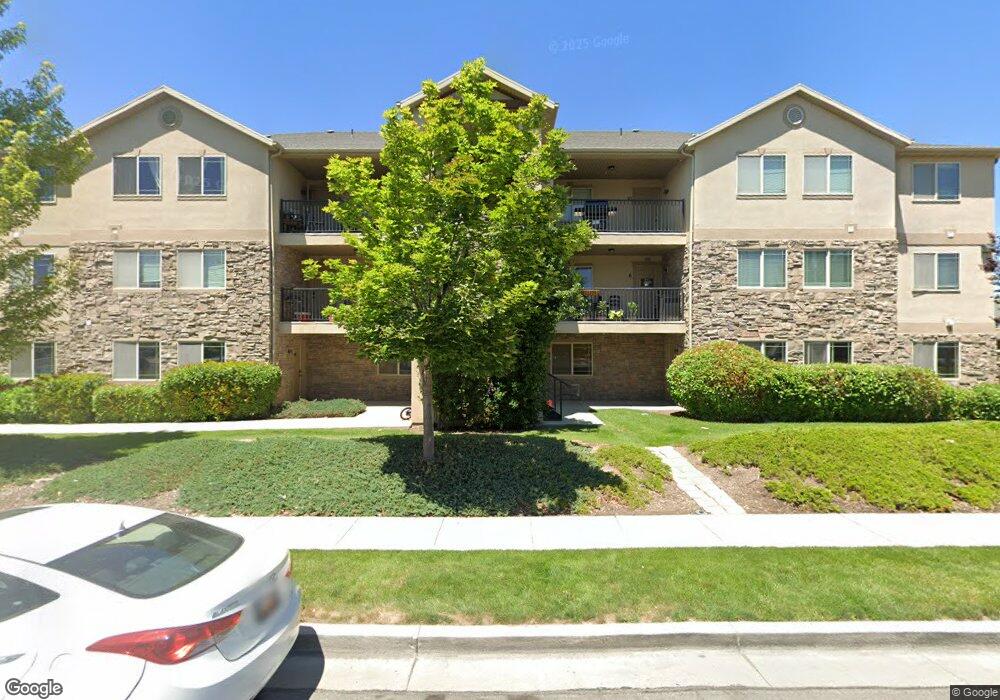
6961 S Village River Ln Unit D6 Midvale, UT 84047
Estimated Value: $352,000 - $412,000
3
Beds
2
Baths
1,215
Sq Ft
$306/Sq Ft
Est. Value
About This Home
This home is located at 6961 S Village River Ln Unit D6, Midvale, UT 84047 and is currently estimated at $372,245, approximately $306 per square foot. 6961 S Village River Ln Unit D6 is a home located in Salt Lake County with nearby schools including East Midvale Elementary School, Midvale Middle School, and Hillcrest High School.
Ownership History
Date
Name
Owned For
Owner Type
Purchase Details
Closed on
May 21, 2020
Sold by
Johansen James A
Bought by
Knutson Angela and Theide Colleen
Current Estimated Value
Home Financials for this Owner
Home Financials are based on the most recent Mortgage that was taken out on this home.
Original Mortgage
$233,700
Outstanding Balance
$207,091
Interest Rate
3.3%
Mortgage Type
New Conventional
Estimated Equity
$165,154
Purchase Details
Closed on
Jun 23, 2014
Sold by
Webster Donald
Bought by
Johansen James A
Purchase Details
Closed on
Jan 15, 2013
Sold by
Webster Candace
Bought by
Webster Donald
Purchase Details
Closed on
Jul 3, 2008
Sold by
D G Development & Investment Inc
Bought by
Webster Donald E and Webster Candace
Home Financials for this Owner
Home Financials are based on the most recent Mortgage that was taken out on this home.
Original Mortgage
$139,920
Interest Rate
6.04%
Mortgage Type
Unknown
Create a Home Valuation Report for This Property
The Home Valuation Report is an in-depth analysis detailing your home's value as well as a comparison with similar homes in the area
Home Values in the Area
Average Home Value in this Area
Purchase History
| Date | Buyer | Sale Price | Title Company |
|---|---|---|---|
| Knutson Angela | -- | Cottonwood Title | |
| Johansen James A | -- | Advanced Title Slc | |
| Webster Donald | -- | None Available | |
| Webster Donald E | -- | Backman Title Services |
Source: Public Records
Mortgage History
| Date | Status | Borrower | Loan Amount |
|---|---|---|---|
| Open | Knutson Angela | $233,700 | |
| Previous Owner | Webster Donald E | $139,920 |
Source: Public Records
Tax History Compared to Growth
Tax History
| Year | Tax Paid | Tax Assessment Tax Assessment Total Assessment is a certain percentage of the fair market value that is determined by local assessors to be the total taxable value of land and additions on the property. | Land | Improvement |
|---|---|---|---|---|
| 2025 | $2,045 | $357,100 | $107,100 | $250,000 |
| 2024 | $2,045 | $348,800 | $104,600 | $244,200 |
| 2023 | $1,997 | $338,300 | $101,500 | $236,800 |
| 2022 | $2,093 | $346,200 | $103,800 | $242,400 |
| 2021 | $1,739 | $246,800 | $74,000 | $172,800 |
| 2020 | $1,638 | $220,700 | $66,200 | $154,500 |
| 2019 | $1,578 | $207,100 | $62,100 | $145,000 |
| 2018 | $1,480 | $197,100 | $59,100 | $138,000 |
| 2017 | $1,408 | $180,800 | $54,200 | $126,600 |
| 2016 | $1,363 | $170,000 | $51,000 | $119,000 |
| 2015 | $1,316 | $161,700 | $48,500 | $113,200 |
| 2014 | $1,333 | $160,100 | $48,000 | $112,100 |
Source: Public Records
Map
Nearby Homes
- 7721 S Village Bend Dr
- 6500 S 990 W
- 6481 S 1090 W Unit 133
- 6494 S 1090 W Unit 152
- 6486 S 1140 W Unit 182
- 6987 Overview Way
- 6414 S 1090 W
- 686 W 6645 S
- 6440 S 1190 W Unit 200
- 1216 W Winchester St
- 7087 S 1205 W
- 1146 Athleen Dr
- 6937 S Hollow View Way
- 7108 S 1205 W
- 6687 Bonham Ln
- 6773 S 1300 W
- 1235 W Athleen Dr
- 6660 S Ryker Vista Ln
- 7541 S Coreiano Ln
- 7340 S Seven Tree Ln Unit 76
- 6961 S Village River Ln Unit D12
- 6961 S Village River Ln Unit D2
- 6961 S Village River Ln Unit D10
- 6961 S Village River Ln Unit D4
- 6961 S Village River Ln Unit 1
- 6961 S Village River Ln Unit 5
- 6961 S Village River Ln Unit D7
- 6961 S Village River Ln Unit D 8
- 6961 S Village River Ln Unit D 11
- 6961 S Village River Ln Unit D3
- 6961 S Village River Ln
- 6961 S Village River Ln Unit D9
- 2926 Village River Ln
- 6973 S Village River Ln Unit C8
- 6973 S Village River Ln Unit C4
- 6973 S Village River Ln Unit C12
- 965 W View Park Dr Unit D1
- 965 W View Park Dr
- 6973 S Village River Ln Unit C11
- 6973 S Village River Ln Unit C2