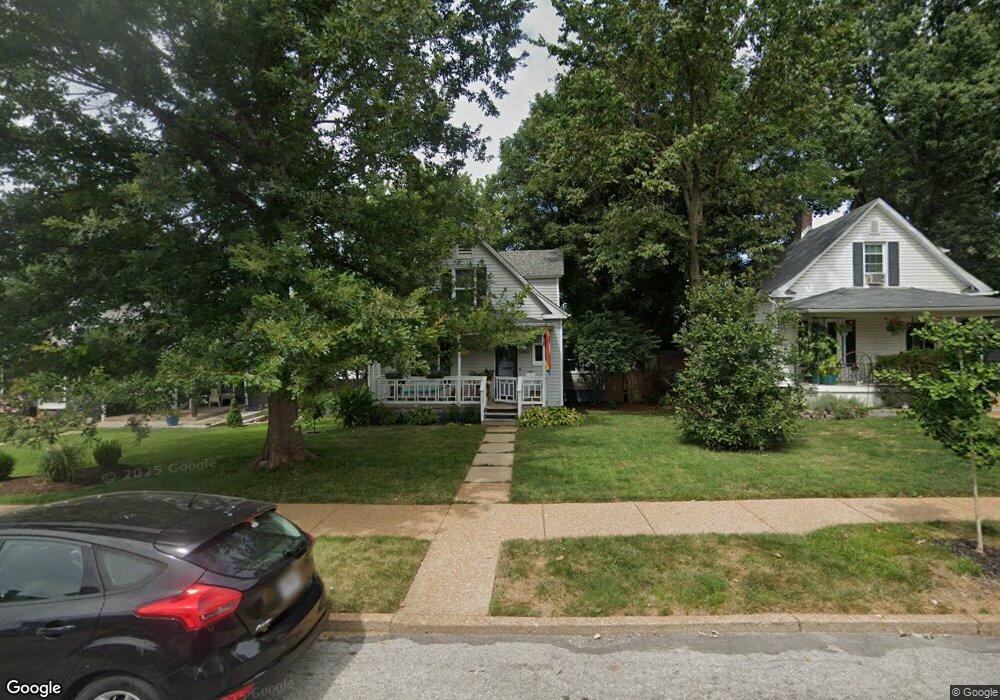
6963 Arthur Ave Saint Louis, MO 63139
Lindenwood Park NeighborhoodEstimated Value: $196,131 - $253,000
2
Beds
2
Baths
1,344
Sq Ft
$166/Sq Ft
Est. Value
About This Home
This home is located at 6963 Arthur Ave, Saint Louis, MO 63139 and is currently estimated at $222,783, approximately $165 per square foot. 6963 Arthur Ave is a home located in St. Louis City with nearby schools including Mason Elementary School, Long International Middle School, and Roosevelt High School.
Ownership History
Date
Name
Owned For
Owner Type
Purchase Details
Closed on
Aug 10, 2012
Sold by
Winkelman Crhistopher Louis
Bought by
Stacy Stephen R
Current Estimated Value
Home Financials for this Owner
Home Financials are based on the most recent Mortgage that was taken out on this home.
Original Mortgage
$120,772
Outstanding Balance
$83,508
Interest Rate
3.63%
Mortgage Type
FHA
Estimated Equity
$139,275
Purchase Details
Closed on
Apr 28, 2006
Sold by
Meadows John and Meadows Carla
Bought by
Winkelmann Christopher Louis
Home Financials for this Owner
Home Financials are based on the most recent Mortgage that was taken out on this home.
Original Mortgage
$108,720
Interest Rate
6.33%
Mortgage Type
Fannie Mae Freddie Mac
Purchase Details
Closed on
May 26, 2000
Sold by
Sexton Robert W
Bought by
Meadows John and Meadows Carla
Home Financials for this Owner
Home Financials are based on the most recent Mortgage that was taken out on this home.
Original Mortgage
$74,882
Interest Rate
8.17%
Mortgage Type
FHA
Create a Home Valuation Report for This Property
The Home Valuation Report is an in-depth analysis detailing your home's value as well as a comparison with similar homes in the area
Home Values in the Area
Average Home Value in this Area
Purchase History
| Date | Buyer | Sale Price | Title Company |
|---|---|---|---|
| Stacy Stephen R | -- | Ctc | |
| Winkelmann Christopher Louis | -- | None Available | |
| Meadows John | -- | -- |
Source: Public Records
Mortgage History
| Date | Status | Borrower | Loan Amount |
|---|---|---|---|
| Open | Stacy Stephen R | $120,772 | |
| Previous Owner | Winkelmann Christopher Louis | $108,720 | |
| Previous Owner | Meadows John | $74,882 |
Source: Public Records
Tax History
| Year | Tax Paid | Tax Assessment Tax Assessment Total Assessment is a certain percentage of the fair market value that is determined by local assessors to be the total taxable value of land and additions on the property. | Land | Improvement |
|---|---|---|---|---|
| 2025 | $2,184 | $30,330 | $2,850 | $27,480 |
| 2024 | $2,078 | $25,750 | $2,850 | $22,900 |
| 2023 | $2,078 | $25,750 | $2,850 | $22,900 |
| 2022 | $1,985 | $23,670 | $2,850 | $20,820 |
| 2021 | $1,982 | $23,670 | $2,850 | $20,820 |
| 2020 | $1,797 | $21,600 | $2,850 | $18,750 |
| 2019 | $1,791 | $21,600 | $2,850 | $18,750 |
| 2018 | $1,527 | $17,800 | $2,620 | $15,180 |
| 2017 | $1,501 | $17,800 | $2,620 | $15,180 |
| 2016 | $1,410 | $16,490 | $2,620 | $13,870 |
| 2015 | $1,280 | $16,490 | $2,620 | $13,870 |
| 2014 | $1,229 | $16,490 | $2,620 | $13,870 |
| 2013 | -- | $15,830 | $2,620 | $13,210 |
Source: Public Records
Map
Nearby Homes
- 6924 Fyler Ave
- 3308 Jamieson Ave
- 6969 Marquette Ave
- 6822 Hancock Ave
- 6837 Bradley Ave
- 6959 Oleatha Ave
- 6935 Pernod Ave
- 7056 Oleatha Ave
- 3558 Wabash Ave
- 3205 Ivanhoe Ave
- 7309 Esplanade St
- 3710 Berger Ave
- 7096 Tholozan Ave
- 6544 Marquette Ave
- 3469 Cambridge Ave
- 6639 Arsenal St
- 3903 Prather Ave
- 6424 Bradley Ave
- 6973 Winona Ave
- 7336 Flora Ave
- 6957 Arthur Ave
- 6969 Arthur Ave
- 6958 Fyler Ave
- 6947 Arthur Ave
- 6945 Arthur Ave
- 6962 Arthur Ave
- 6964 Arthur Ave
- 6954 Arthur Ave
- 6954 Fyler Ave
- 6968 Arthur Ave
- 6939 Arthur Ave
- 6974 Arthur Ave
- 6948 Arthur Ave
- 6944 Fyler Ave
- 6948 Fyler Ave
- 3410 Mccausland Ave
- 6944 Arthur Ave
- 6933 Arthur Ave
- 6938 Arthur Ave
- 6938 Fyler Ave
Your Personal Tour Guide
Ask me questions while you tour the home.