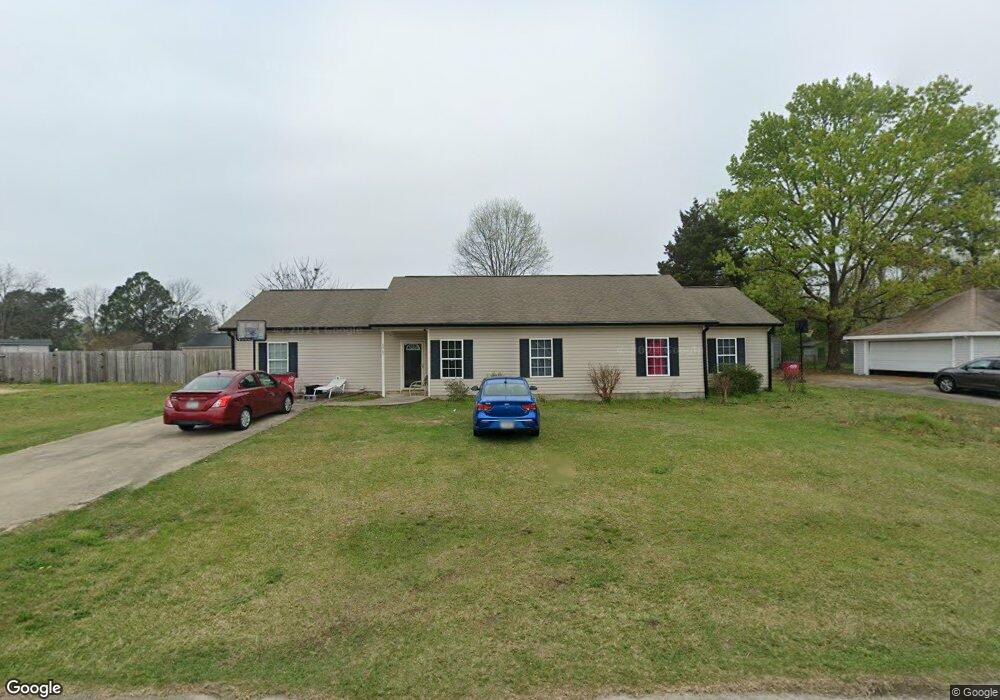
6965 Andalusia Dr Macon, GA 31216
Estimated Value: $256,000 - $272,000
5
Beds
3
Baths
2,106
Sq Ft
$124/Sq Ft
Est. Value
About This Home
This home is located at 6965 Andalusia Dr, Macon, GA 31216 and is currently estimated at $261,760, approximately $124 per square foot. 6965 Andalusia Dr is a home located in Bibb County with nearby schools including Heard Elementary School, Rutland Middle School, and Rutland High School.
Ownership History
Date
Name
Owned For
Owner Type
Purchase Details
Closed on
Feb 21, 2012
Sold by
Barnes James C
Bought by
Moody Eric B and Moody Teonshe
Current Estimated Value
Home Financials for this Owner
Home Financials are based on the most recent Mortgage that was taken out on this home.
Original Mortgage
$122,477
Outstanding Balance
$83,685
Interest Rate
3.91%
Mortgage Type
VA
Estimated Equity
$178,075
Purchase Details
Closed on
May 13, 2011
Sold by
Sims Jones Sherita R and Jones Shermaine D
Bought by
Barnes James C
Purchase Details
Closed on
Aug 25, 2005
Sold by
Doe Curtis F
Bought by
Sims Jones Sherita R and Jones Shermaine D
Home Financials for this Owner
Home Financials are based on the most recent Mortgage that was taken out on this home.
Original Mortgage
$120,500
Interest Rate
5.64%
Mortgage Type
New Conventional
Create a Home Valuation Report for This Property
The Home Valuation Report is an in-depth analysis detailing your home's value as well as a comparison with similar homes in the area
Home Values in the Area
Average Home Value in this Area
Purchase History
| Date | Buyer | Sale Price | Title Company |
|---|---|---|---|
| Moody Eric B | $119,900 | None Available | |
| Barnes James C | $15,000 | None Available | |
| Sims Jones Sherita R | $121,000 | None Available |
Source: Public Records
Mortgage History
| Date | Status | Borrower | Loan Amount |
|---|---|---|---|
| Open | Moody Eric B | $122,477 | |
| Previous Owner | Sims Jones Sherita R | $120,500 |
Source: Public Records
Tax History Compared to Growth
Tax History
| Year | Tax Paid | Tax Assessment Tax Assessment Total Assessment is a certain percentage of the fair market value that is determined by local assessors to be the total taxable value of land and additions on the property. | Land | Improvement |
|---|---|---|---|---|
| 2025 | $2,375 | $103,642 | $10,000 | $93,642 |
| 2024 | $2,045 | $87,526 | $10,000 | $77,526 |
| 2023 | $1,588 | $87,526 | $10,000 | $77,526 |
| 2022 | $1,388 | $47,089 | $3,247 | $43,842 |
| 2021 | $1,523 | $47,089 | $3,247 | $43,842 |
| 2020 | $1,556 | $47,089 | $3,247 | $43,842 |
| 2019 | $1,429 | $47,089 | $3,247 | $43,842 |
| 2018 | $2,828 | $51,177 | $3,247 | $47,930 |
| 2017 | $1,655 | $51,177 | $3,247 | $47,930 |
| 2016 | $1,399 | $52,570 | $3,247 | $49,323 |
| 2015 | $2,448 | $56,987 | $6,494 | $50,493 |
| 2014 | $2,400 | $56,987 | $6,494 | $50,493 |
Source: Public Records
Map
Nearby Homes
- 330 Cody Dr
- 102 Haylie Ct
- 328 Cody Dr
- 104 Alayna Ct
- Jodeco Plan at Goodall Woods
- Sierra Plan at Goodall Woods
- Poplar Plan at Goodall Woods
- Russell Plan at Goodall Woods
- Clayton Plan at Goodall Woods
- 108 Alayna Ct
- 318 Cody Dr
- 310 Cody Dr
- 320 Cody Dr
- 303 Cody Dr
- 334 Cody Dr
- 332 Cody Dr
- 813 Ocala National Trail
- 312 Mill Meadow Rd
- 191 Goodall Woods Dr
- 174 Goodall Woods Dr
- 6963 Andalusia Dr
- 6969 Andalusia Dr
- 6959 Andalusia Dr
- 6966 Barcelona Blvd
- 6962 Barcelona Blvd
- 6970 Barcelona Blvd
- 6971 Andalusia Dr
- 6971 Adnalusia Dr
- 6964 Andalusia Dr
- 6968 Andalusia Dr
- 6958 Barcelona Blvd
- 0 Andalusia Dr Unit 8234504
- 0 Andalusia Dr Unit 8115939
- 0 Andalusia Dr
- 6960 Andalusia Dr
- 6955 Andalusia Dr
- 6982 Barcelona Blvd
- 6958 Andalusia Dr
- 6954 Barcelona Blvd
- 6980 Andalusia Dr