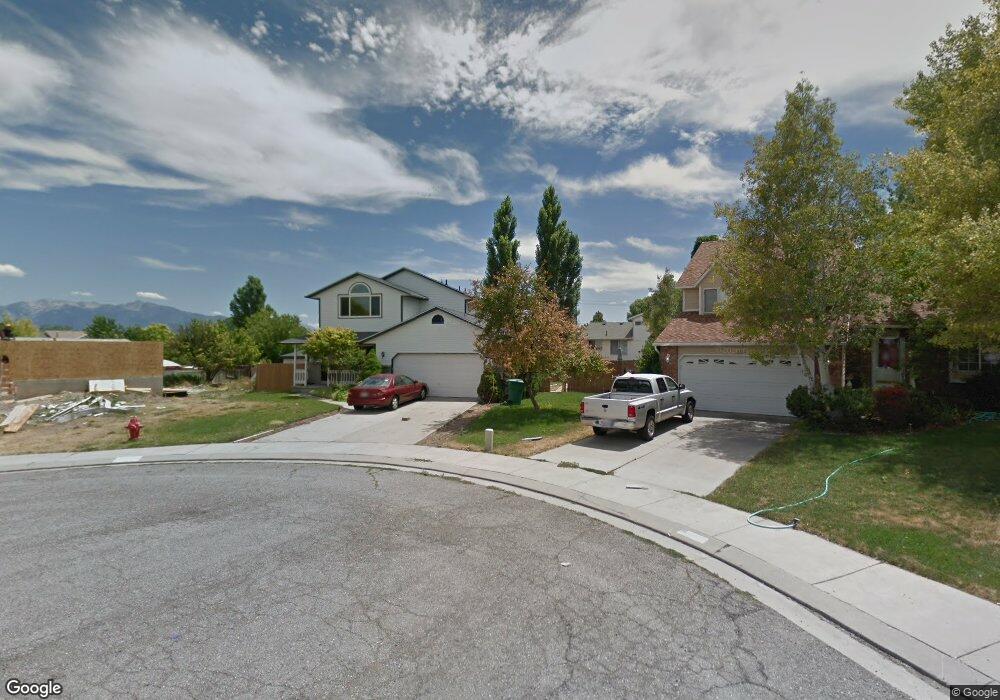
6965 S Foxflower Ct West Jordan, UT 84081
Oquirrh NeighborhoodEstimated Value: $521,000 - $574,000
4
Beds
3
Baths
1,779
Sq Ft
$302/Sq Ft
Est. Value
About This Home
This home is located at 6965 S Foxflower Ct, West Jordan, UT 84081 and is currently estimated at $537,974, approximately $302 per square foot. 6965 S Foxflower Ct is a home located in Salt Lake County with nearby schools including Mountain Shadows School, West Hills Middle School, and Copper Hills High School.
Ownership History
Date
Name
Owned For
Owner Type
Purchase Details
Closed on
May 29, 2018
Sold by
Ye Huihong and Wingle Matthew Rex
Bought by
Chatwin Matthew and Chatwin Rachael
Current Estimated Value
Home Financials for this Owner
Home Financials are based on the most recent Mortgage that was taken out on this home.
Original Mortgage
$301,150
Outstanding Balance
$259,855
Interest Rate
4.4%
Mortgage Type
New Conventional
Estimated Equity
$278,119
Purchase Details
Closed on
Jul 14, 2010
Sold by
Ye Huihong
Bought by
Ye Huihong and Wingle Matthew Rex
Home Financials for this Owner
Home Financials are based on the most recent Mortgage that was taken out on this home.
Original Mortgage
$144,500
Interest Rate
4.68%
Mortgage Type
New Conventional
Purchase Details
Closed on
May 18, 2006
Sold by
Young Orrin E
Bought by
Ye Huihong
Purchase Details
Closed on
Mar 21, 2005
Sold by
Sullivan Donald R and Sullivan Johnette
Bought by
Young Orrin E and Ye Huihong
Home Financials for this Owner
Home Financials are based on the most recent Mortgage that was taken out on this home.
Original Mortgage
$162,450
Interest Rate
5.61%
Mortgage Type
FHA
Create a Home Valuation Report for This Property
The Home Valuation Report is an in-depth analysis detailing your home's value as well as a comparison with similar homes in the area
Home Values in the Area
Average Home Value in this Area
Purchase History
| Date | Buyer | Sale Price | Title Company |
|---|---|---|---|
| Chatwin Matthew | -- | Inwest Title Svcs Slc | |
| Ye Huihong | -- | Richland Title Ins Agency In | |
| Ye Huihong | -- | Accommodation | |
| Young Orrin E | -- | Equity Title |
Source: Public Records
Mortgage History
| Date | Status | Borrower | Loan Amount |
|---|---|---|---|
| Open | Chatwin Matthew | $301,150 | |
| Previous Owner | Ye Huihong | $144,500 | |
| Previous Owner | Young Orrin E | $162,450 |
Source: Public Records
Tax History Compared to Growth
Tax History
| Year | Tax Paid | Tax Assessment Tax Assessment Total Assessment is a certain percentage of the fair market value that is determined by local assessors to be the total taxable value of land and additions on the property. | Land | Improvement |
|---|---|---|---|---|
| 2025 | $2,905 | $521,000 | $133,600 | $387,400 |
| 2024 | $2,905 | $491,000 | $126,000 | $365,000 |
| 2023 | $2,905 | $459,400 | $121,100 | $338,300 |
| 2022 | $2,895 | $457,000 | $118,700 | $338,300 |
| 2021 | $2,544 | $372,800 | $91,300 | $281,500 |
| 2020 | $2,368 | $324,200 | $91,300 | $232,900 |
| 2019 | $1,768 | $311,400 | $86,200 | $225,200 |
| 2018 | $2,075 | $274,100 | $86,200 | $187,900 |
| 2017 | $1,868 | $243,200 | $86,200 | $157,000 |
| 2016 | $1,848 | $226,300 | $86,200 | $140,100 |
| 2015 | $1,768 | $208,900 | $82,500 | $126,400 |
| 2014 | $1,722 | $199,800 | $80,000 | $119,800 |
Source: Public Records
Map
Nearby Homes
- 7043 Orion Hill Rd
- 7043 S Orion Hill Rd
- 7232 W Terraine Rd
- 7238 W Terraine Rd
- 7246 W Terraine Rd
- 6928 Beargrass Rd
- 5208 W Case Mountain Rd
- 5151 Case Mountain Rd
- 6839 S Cyclamen Dr
- 7758 S Iron Core Ln
- 7146 W Owens View Way Unit 204
- 7259 W Cibola Rd
- 6853 Mullien Dr Unit 5420
- 6922 Mullien Dr
- 5281 Saguaro Dr
- 5466 Ticklegrass Rd
- 7288 Comet Hill Cir
- 4983 Shooting Star Ave
- 6706 Marshrock Rd
- 5183 W Cadenza Dr
- 6965 S Foxflower Ct
- 6961 Foxflower Ct
- 5234 W 7000 S
- 5226 W 7000 S
- 5226 W 7000 S Unit 3109
- 6970 S Foxflower Ct
- 6970 Foxflower Ct
- 5242 W 7000 S
- 5218 W 7000 S
- 6955 Foxflower Ct
- 6955 S Foxflower Ct
- 6966 Foxflower Ct
- 6978 S Sparrowtail Rd
- 6968 S Sparrowtail Rd
- 6968 Sparrowtail Rd
- 5250 W 7000 S
- 6958 Foxflower Ct
- 5212 W 7000 S
- 6945 Foxflower Ct
- 6978 Sparrowtail Rd