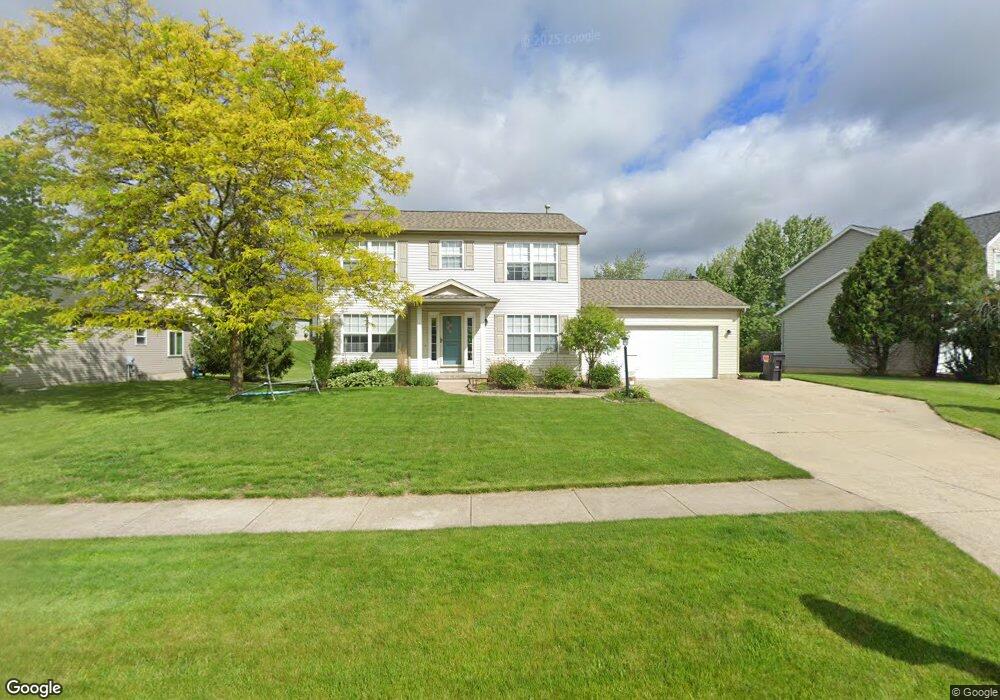
6965 Sienna Dr SE Unit 32 Caledonia, MI 49316
Estimated Value: $375,000 - $403,000
4
Beds
3
Baths
2,400
Sq Ft
$164/Sq Ft
Est. Value
About This Home
This home is located at 6965 Sienna Dr SE Unit 32, Caledonia, MI 49316 and is currently estimated at $394,149, approximately $164 per square foot. 6965 Sienna Dr SE Unit 32 is a home located in Kent County with nearby schools including Explorer Elementary School, Pinewood Middle School, and East Kentwood High School.
Ownership History
Date
Name
Owned For
Owner Type
Purchase Details
Closed on
Apr 12, 2016
Sold by
Clover Rachel Marie and Clover Mark Donald
Bought by
Clover Rachel M and Rachel Clover Trust
Current Estimated Value
Purchase Details
Closed on
Jan 14, 2010
Sold by
Clover Mark Donald
Bought by
Clover Mark Donald and Clover Rachel Marie
Purchase Details
Closed on
Nov 30, 2007
Sold by
Nguyen Quy H and Nguyen Hieu T
Bought by
Clover Mark D
Home Financials for this Owner
Home Financials are based on the most recent Mortgage that was taken out on this home.
Original Mortgage
$148,500
Interest Rate
6.17%
Mortgage Type
Purchase Money Mortgage
Purchase Details
Closed on
Oct 31, 2000
Bought by
Holwerda Bldrs Llc and Clover Mark D
Purchase Details
Closed on
Oct 16, 2000
Bought by
Holwerda Bldrs Llc and Clover Mark D
Create a Home Valuation Report for This Property
The Home Valuation Report is an in-depth analysis detailing your home's value as well as a comparison with similar homes in the area
Home Values in the Area
Average Home Value in this Area
Purchase History
| Date | Buyer | Sale Price | Title Company |
|---|---|---|---|
| Clover Rachel M | -- | Attorney | |
| Clover Mark Donald | -- | None Available | |
| Clover Mark D | $159,500 | None Available | |
| Holwerda Bldrs Llc | -- | -- | |
| Holwerda Bldrs Llc | $32,900 | -- |
Source: Public Records
Mortgage History
| Date | Status | Borrower | Loan Amount |
|---|---|---|---|
| Previous Owner | Clover Mark D | $148,500 |
Source: Public Records
Tax History Compared to Growth
Tax History
| Year | Tax Paid | Tax Assessment Tax Assessment Total Assessment is a certain percentage of the fair market value that is determined by local assessors to be the total taxable value of land and additions on the property. | Land | Improvement |
|---|---|---|---|---|
| 2025 | $2,798 | $163,800 | $0 | $0 |
| 2024 | $2,418 | $153,900 | $0 | $0 |
| 2023 | $2,418 | $134,600 | $0 | $0 |
| 2022 | $2,418 | $121,400 | $0 | $0 |
| 2021 | $2,418 | $111,400 | $0 | $0 |
| 2020 | $2,418 | $109,900 | $0 | $0 |
| 2019 | $2,418 | $99,400 | $0 | $0 |
| 2018 | $2,418 | $99,100 | $21,000 | $78,100 |
| 2017 | $0 | $90,400 | $0 | $0 |
| 2016 | $0 | $85,800 | $0 | $0 |
| 2015 | -- | $85,800 | $0 | $0 |
| 2013 | -- | $78,200 | $0 | $0 |
Source: Public Records
Map
Nearby Homes
- 6969 Terra Cotta Dr SE
- 6911 Shady Knoll Dr SE
- 6655 Leisure Way Dr SE
- 2818 Bridgeside Dr SE
- 6751 Vantage Dr SE
- 6903 Hartman Dr SE
- 2850 Valley Spring Dr SE
- 2238 Glenn Canyon Dr SE
- 6495 Avalon Dr SE
- 6694 Dutton Trail Dr SE
- 6785 Summerbreeze Dr SE
- 2355 76th St SE
- 7115 Glen Creek Dr SE
- 2531 76th St SE
- Integrity 1880 Plan at Thornapple Farms
- Traditions 2800 V8.0b Plan at Thornapple Farms - Traditions
- Traditions 3100 Plan at Thornapple Farms - Traditions
- Traditions 3390 V8.2b Plan at Thornapple Farms - Traditions
- Elements 1800 Plan at Thornapple Farms - Elements
- Traditions 1600 V8.0b Plan at Thornapple Farms - Traditions
- 6941 Sienna Dr SE
- 6981 Sienna Dr SE Unit 33
- 6899 Sienna Dr SE Unit 30
- 6890 Terra Cotta Dr SE
- 6902 Terra Cotta Dr SE Unit 19
- 6997 Sienna Dr SE
- 6968 Sienna Dr SE Unit 43
- 6876 Terra Cotta Dr SE
- 6950 Sienna Dr SE
- 6980 Sienna Dr SE
- 6885 Sienna Dr SE
- 6934 Sienna Dr SE
- 6862 Terra Cotta Dr SE
- 6916 Sienna Dr SE
- 6871 Sienna Dr SE
- 6968 Terra Cotta Dr SE
- 6894 Sienna Dr SE
- 6850 Terra Cotta Dr SE
- 6895 Terra Cotta Dr SE Unit 12
- 6919 Terra Cotta Dr SE Unit 14