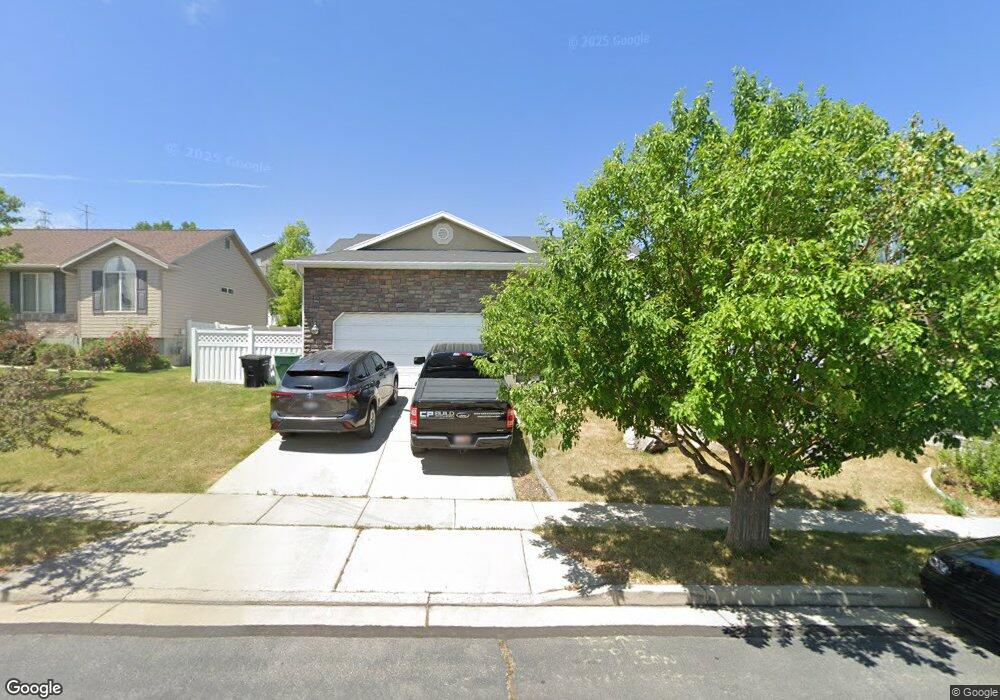
6968 Adventure Way West Jordan, UT 84081
Oquirrh NeighborhoodEstimated Value: $552,000 - $594,000
3
Beds
2
Baths
2,440
Sq Ft
$232/Sq Ft
Est. Value
About This Home
This home is located at 6968 Adventure Way, West Jordan, UT 84081 and is currently estimated at $565,037, approximately $231 per square foot. 6968 Adventure Way is a home located in Salt Lake County with nearby schools including Falcon Ridge School, Sunset Ridge Middle School, and Copper Hills High School.
Ownership History
Date
Name
Owned For
Owner Type
Purchase Details
Closed on
Aug 19, 2020
Sold by
Poulsen Keawe and Guttierrez Poulsen Paola
Bought by
Willis Caleb and Willis Tashina
Current Estimated Value
Home Financials for this Owner
Home Financials are based on the most recent Mortgage that was taken out on this home.
Original Mortgage
$390,791
Outstanding Balance
$346,659
Interest Rate
3%
Mortgage Type
FHA
Estimated Equity
$218,378
Purchase Details
Closed on
Aug 12, 2005
Sold by
Midwest Construction Co Inc
Bought by
Routa Michael and Routa Brenda
Home Financials for this Owner
Home Financials are based on the most recent Mortgage that was taken out on this home.
Original Mortgage
$212,950
Interest Rate
5.56%
Mortgage Type
Fannie Mae Freddie Mac
Create a Home Valuation Report for This Property
The Home Valuation Report is an in-depth analysis detailing your home's value as well as a comparison with similar homes in the area
Home Values in the Area
Average Home Value in this Area
Purchase History
| Date | Buyer | Sale Price | Title Company |
|---|---|---|---|
| Willis Caleb | -- | First American Title | |
| Routa Michael | -- | Patriot Title Llc | |
| Midwest Construction Co Inc | -- | Patriot Title Llc |
Source: Public Records
Mortgage History
| Date | Status | Borrower | Loan Amount |
|---|---|---|---|
| Open | Willis Caleb | $390,791 | |
| Previous Owner | Routa Michael | $212,950 |
Source: Public Records
Tax History Compared to Growth
Tax History
| Year | Tax Paid | Tax Assessment Tax Assessment Total Assessment is a certain percentage of the fair market value that is determined by local assessors to be the total taxable value of land and additions on the property. | Land | Improvement |
|---|---|---|---|---|
| 2025 | $2,873 | $508,900 | $150,000 | $358,900 |
| 2024 | $2,873 | $485,600 | $144,200 | $341,400 |
| 2023 | $2,888 | $458,700 | $138,700 | $320,000 |
| 2022 | $3,025 | $477,500 | $136,000 | $341,500 |
| 2021 | $2,656 | $389,300 | $104,600 | $284,700 |
| 2020 | $2,364 | $323,600 | $97,000 | $226,600 |
| 2019 | $2,308 | $309,000 | $91,500 | $217,500 |
| 2018 | $2,151 | $284,200 | $91,500 | $192,700 |
| 2017 | $2,044 | $266,100 | $91,500 | $174,600 |
| 2016 | $2,107 | $258,100 | $84,700 | $173,400 |
| 2015 | $1,819 | $214,900 | $91,100 | $123,800 |
| 2014 | $1,778 | $206,300 | $88,300 | $118,000 |
Source: Public Records
Map
Nearby Homes
- 6977 W Hidden Way S Unit 147
- 6739 S Sol Rise Dr
- 6721 Adventure Way
- 7134 S Rialto Way
- 5502 Starflower Way
- 5732 W Moon Crest Ct
- 6922 Mullien Dr
- 5557 W Joshua Cir
- 5466 Ticklegrass Rd
- 7758 S Iron Core Ln
- 7146 W Owens View Way Unit 204
- 7259 W Cibola Rd
- 6853 Mullien Dr Unit 5420
- 5818 W Whisper View Ct
- 5818 W Whisper View Ct Unit 336
- 7296 S Sophia Ridge Ct
- 6116 W Graceland Way
- 6839 S Cyclamen Dr
- 5644 W 7340 S
- 6150 W Nellies St
- 6968 S Adventure Way
- 6978 Adventure Way
- 6956 Adventure Way
- 6956 S Adventure Way
- 6967 S 5785 W
- 6979 S 5785 W
- 6988 S Adventure Way
- 6946 Adventure Way
- 6946 S Adventure Way
- 6988 Adventure Way
- 6957 S 5785 W
- 6989 Adventure Way
- 6969 Adventure Way
- 6991 S 5785 W
- 6991 S 5785 W Unit 312
- 6947 S 5785 W
- 6959 Adventure Way
- 6981 Adventure Way
- 6936 Adventure Way
- 6989 S Adventure Way