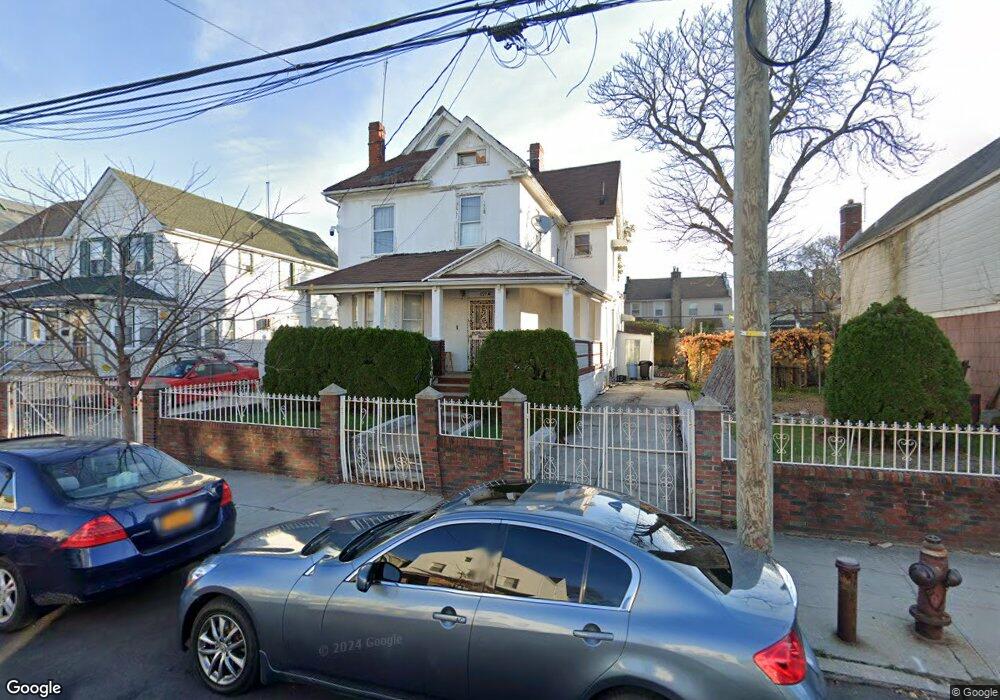
697 E 39th St Brooklyn, NY 11203
East Flatbush NeighborhoodEstimated Value: $787,000 - $906,851
Studio
--
Bath
1,998
Sq Ft
$428/Sq Ft
Est. Value
About This Home
This home is located at 697 E 39th St, Brooklyn, NY 11203 and is currently estimated at $855,213, approximately $428 per square foot. 697 E 39th St is a home located in Kings County with nearby schools including P.S. 198 Brooklyn, Andries Hudde School, and Central Brooklyn Ascend Charter.
Ownership History
Date
Name
Owned For
Owner Type
Purchase Details
Closed on
Sep 4, 2024
Sold by
697 E 39Th St Developement Corp
Bought by
Williamson Archie M
Current Estimated Value
Home Financials for this Owner
Home Financials are based on the most recent Mortgage that was taken out on this home.
Original Mortgage
$425,000
Outstanding Balance
$419,716
Interest Rate
6.78%
Mortgage Type
Purchase Money Mortgage
Estimated Equity
$435,497
Purchase Details
Closed on
Apr 14, 2021
Sold by
Derissaint Marie F
Bought by
697 E 39Th St Development Corp
Purchase Details
Closed on
Jul 11, 2006
Sold by
Derissaint Jean M and Derissaint Marie F
Bought by
Derissaint Marie F
Create a Home Valuation Report for This Property
The Home Valuation Report is an in-depth analysis detailing your home's value as well as a comparison with similar homes in the area
Home Values in the Area
Average Home Value in this Area
Purchase History
| Date | Buyer | Sale Price | Title Company |
|---|---|---|---|
| Williamson Archie M | -- | -- | |
| Williamson Archie M | -- | -- | |
| 697 E 39Th St Development Corp | $20,000 | -- | |
| 697 E 39Th St Development Corp | $20,000 | -- | |
| 697 E 39Th St Development Corp | $20,000 | -- | |
| Derissaint Marie F | -- | -- | |
| Derissaint Marie F | -- | -- |
Source: Public Records
Mortgage History
| Date | Status | Borrower | Loan Amount |
|---|---|---|---|
| Open | Williamson Archie M | $425,000 | |
| Closed | Williamson Archie M | $425,000 | |
| Closed | Derissaint Marie F | $0 |
Source: Public Records
Tax History
| Year | Tax Paid | Tax Assessment Tax Assessment Total Assessment is a certain percentage of the fair market value that is determined by local assessors to be the total taxable value of land and additions on the property. | Land | Improvement |
|---|---|---|---|---|
| 2025 | $4,842 | $68,040 | $18,060 | $49,980 |
| 2024 | $4,842 | $53,760 | $18,060 | $35,700 |
| 2023 | $4,846 | $60,900 | $18,060 | $42,840 |
| 2022 | $4,498 | $64,200 | $18,060 | $46,140 |
| 2021 | $4,478 | $53,220 | $18,060 | $35,160 |
| 2020 | $2,102 | $38,400 | $18,060 | $20,340 |
| 2019 | $4,203 | $38,400 | $18,060 | $20,340 |
| 2018 | $4,053 | $19,884 | $8,267 | $11,617 |
| 2017 | $3,828 | $18,778 | $8,386 | $10,392 |
| 2016 | $3,545 | $17,733 | $8,750 | $8,983 |
| 2015 | $1,917 | $16,744 | $9,987 | $6,757 |
| 2014 | $1,917 | $16,744 | $10,632 | $6,112 |
Source: Public Records
Map
Nearby Homes
Your Personal Tour Guide
Ask me questions while you tour the home.