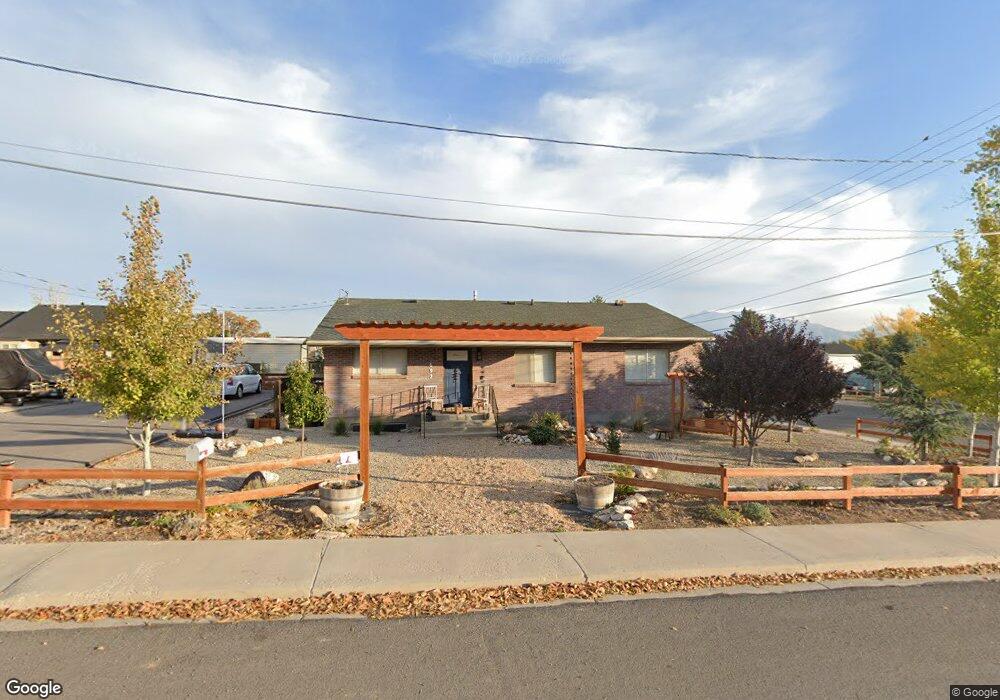
697 E 400 N Payson, UT 84651
Estimated Value: $539,000 - $633,000
5
Beds
3
Baths
3,071
Sq Ft
$189/Sq Ft
Est. Value
About This Home
This home is located at 697 E 400 N, Payson, UT 84651 and is currently estimated at $580,230, approximately $188 per square foot. 697 E 400 N is a home located in Utah County with nearby schools including Barnett Elementary School, Salem Junior High School, and Valley View Middle School.
Ownership History
Date
Name
Owned For
Owner Type
Purchase Details
Closed on
Nov 18, 2024
Sold by
Chamlee Brian
Bought by
Newell Garrick and Newell Darcy
Current Estimated Value
Purchase Details
Closed on
Jun 18, 2014
Sold by
Provstgaard Chris
Bought by
Chamlee Brian
Home Financials for this Owner
Home Financials are based on the most recent Mortgage that was taken out on this home.
Original Mortgage
$147,832
Interest Rate
3.5%
Mortgage Type
FHA
Purchase Details
Closed on
Jun 14, 2007
Sold by
Provstgaard Marian
Bought by
Provstgaard Marian
Create a Home Valuation Report for This Property
The Home Valuation Report is an in-depth analysis detailing your home's value as well as a comparison with similar homes in the area
Home Values in the Area
Average Home Value in this Area
Purchase History
| Date | Buyer | Sale Price | Title Company |
|---|---|---|---|
| Newell Garrick | -- | Oasis Title | |
| Chamlee Brian | -- | Title West | |
| Provstgaard Marian | -- | First American Title Span |
Source: Public Records
Mortgage History
| Date | Status | Borrower | Loan Amount |
|---|---|---|---|
| Previous Owner | Chamlee Brian | $147,832 |
Source: Public Records
Tax History
| Year | Tax Paid | Tax Assessment Tax Assessment Total Assessment is a certain percentage of the fair market value that is determined by local assessors to be the total taxable value of land and additions on the property. | Land | Improvement |
|---|---|---|---|---|
| 2025 | $2,587 | $280,885 | -- | -- |
| 2024 | $2,587 | $263,285 | $0 | $0 |
| 2023 | $2,582 | $263,505 | $0 | $0 |
| 2022 | $2,371 | $237,930 | $0 | $0 |
| 2021 | $2,016 | $324,500 | $100,300 | $224,200 |
| 2020 | $1,912 | $301,100 | $91,200 | $209,900 |
| 2019 | $1,682 | $271,600 | $81,700 | $189,900 |
| 2018 | $1,530 | $238,100 | $73,000 | $165,100 |
| 2017 | $1,433 | $119,955 | $0 | $0 |
| 2016 | $1,340 | $111,430 | $0 | $0 |
| 2015 | $1,193 | $98,560 | $0 | $0 |
| 2014 | $1,174 | $97,680 | $0 | $0 |
Source: Public Records
Map
Nearby Homes
Your Personal Tour Guide
Ask me questions while you tour the home.