M
Seller's Agent in 2020
Maxine Foster
Keller Williams Real Estate - Stroudsburg
(570) 492-0982
88 Total Sales

Estimated Value: $127,000 - $175,000
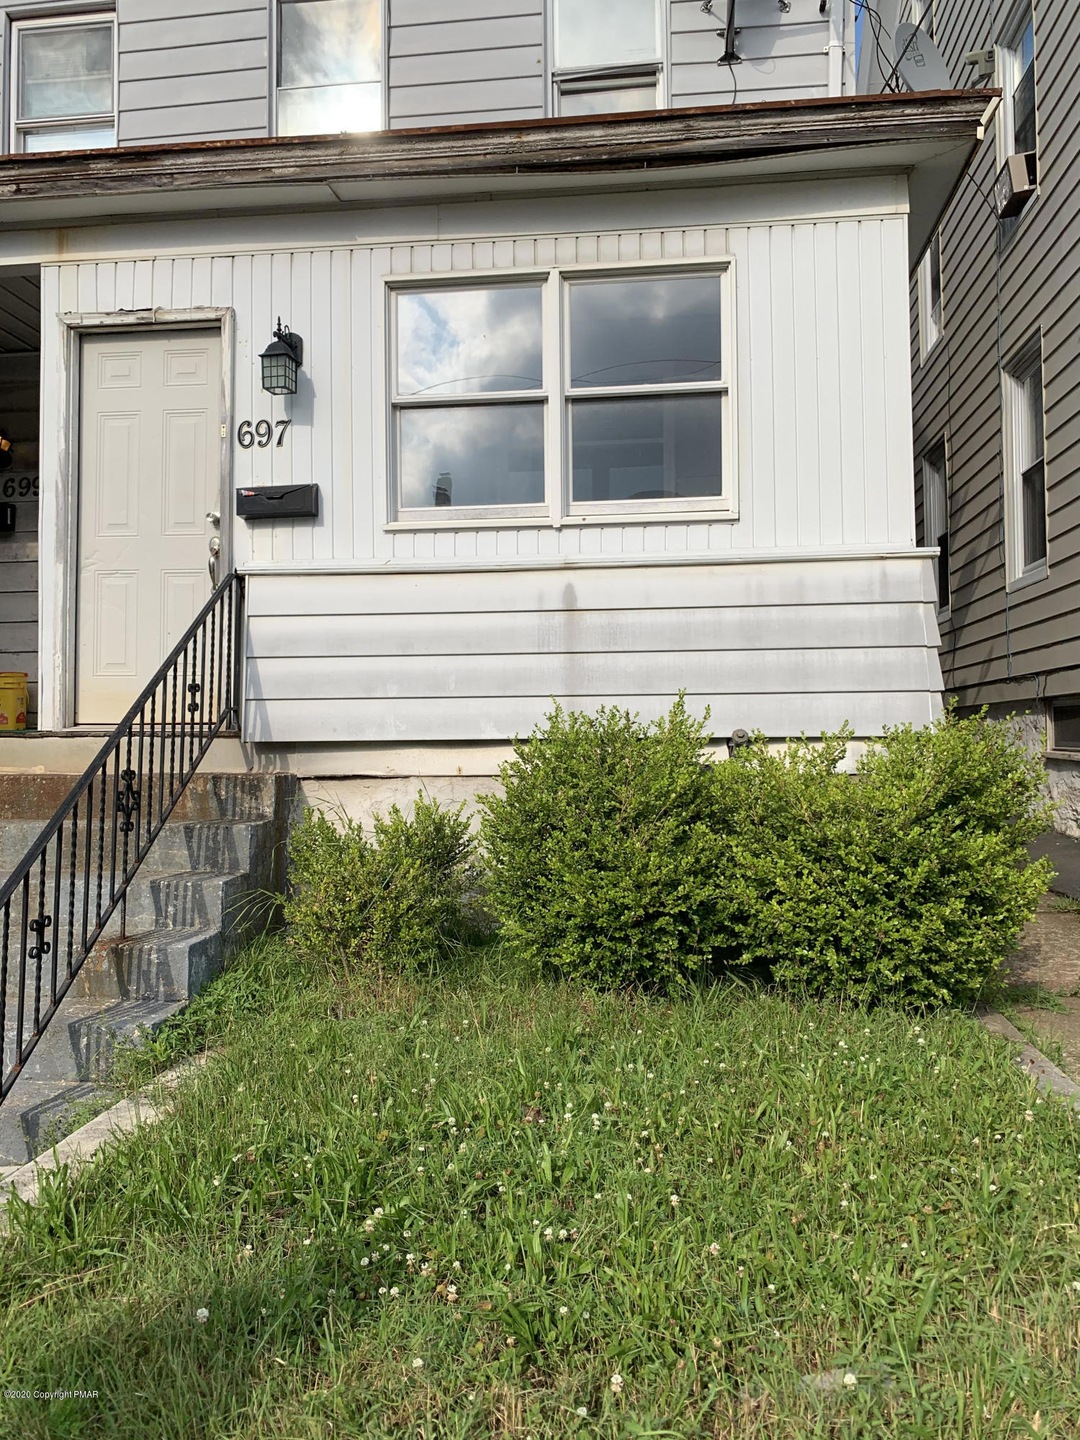
Calling all First Time Home Buyers and Investors, This Home has 3 Spacious Bedrooms, Large Living Room and 1.5 Bathrooms, Large Kitchen and a Large Loft with 2 Bonus Rooms that can be used as additional Bedrooms. Property has been priced to sell and is being sold ''As Is''
Last Agent to Sell the Property
Keller Williams Real Estate - Stroudsburg License #RS346127 Listed on: 07/20/2020

Last Buyer's Agent
Sandra Ortiz
Pocono Properties Rentals & Sales License #RS289957
| Date | Buyer | Sale Price | Title Company |
|---|---|---|---|
| Hernandez Mata Ileana R | $138,300 | None Listed On Document | |
| Bui Danny | $75,000 | Wetzel Abstract Llc | |
| Womack Craig A | $9,000 | None Available | |
| Briarpath Properties Llc | $6,550 | None Available | |
| The Bank Of New York Mellon | $4,696 | None Available |
| Date | Status | Borrower | Loan Amount |
|---|---|---|---|
| Open | Hernandez Mata Ileana R | $131,385 |
| Date | Event | Price | List to Sale | Price per Sq Ft |
|---|---|---|---|---|
| 09/10/2020 09/10/20 | Sold | $75,000 | -6.1% | $50 / Sq Ft |
| 07/22/2020 07/22/20 | Pending | -- | -- | -- |
| 07/17/2020 07/17/20 | For Sale | $79,900 | -- | $53 / Sq Ft |
| Year | Tax Paid | Tax Assessment Tax Assessment Total Assessment is a certain percentage of the fair market value that is determined by local assessors to be the total taxable value of land and additions on the property. | Land | Improvement |
|---|---|---|---|---|
| 2026 | $1,238 | $60,300 | $20,800 | $39,500 |
| 2025 | $1,732 | $60,300 | $20,800 | $39,500 |
| 2024 | $1,623 | $60,300 | $20,800 | $39,500 |
| 2023 | $1,517 | $60,300 | $20,800 | $39,500 |
| 2022 | $1,506 | $60,300 | $20,800 | $39,500 |
| 2021 | $1,471 | $60,300 | $20,800 | $39,500 |
| 2020 | $1,314 | $60,300 | $20,800 | $39,500 |
| 2019 | $1,356 | $60,300 | $20,800 | $39,500 |
| 2018 | $1,310 | $60,300 | $20,800 | $39,500 |
| 2017 | $1,208 | $60,300 | $20,800 | $39,500 |
| 2016 | $859 | $60,300 | $20,800 | $39,500 |
| 2015 | -- | $60,300 | $20,800 | $39,500 |
| 2014 | -- | $60,300 | $20,800 | $39,500 |
M
Seller's Agent in 2020
Maxine Foster
Keller Williams Real Estate - Stroudsburg
(570) 492-0982
88 Total Sales
S
Buyer's Agent in 2020
Sandra Ortiz
Pocono Properties Rentals & Sales
Source: Pocono Mountains Association of REALTORS®
MLS Number: PM-79338
APN: 71-T8NW42-017-011-000
Disclaimer: Certain information contained herein is derived from information provided by parties other than Homes.com. All information provided is deemed reliable, but is not guaranteed to be accurate and should be independently verified.
![]() The data relating to real estate for sale on this web site includes listings held by MLS-IDX Participants of the Internet Data Exchange program of the Multiple Listing Service of the Pocono Mountains Association of Realtors®. Listings marked with the Internet Data Exchange logo are not necessarilty the listings of the owner of this web site. All listing data is the copyrighted property of the aforesaid Associations and its MLS-IDX Participants with all rights reserved. The information contained herein is believed to be accurate, but no warranty as such is expressed or implied.
The data relating to real estate for sale on this web site includes listings held by MLS-IDX Participants of the Internet Data Exchange program of the Multiple Listing Service of the Pocono Mountains Association of Realtors®. Listings marked with the Internet Data Exchange logo are not necessarilty the listings of the owner of this web site. All listing data is the copyrighted property of the aforesaid Associations and its MLS-IDX Participants with all rights reserved. The information contained herein is believed to be accurate, but no warranty as such is expressed or implied.
Ask me questions while you tour the home.