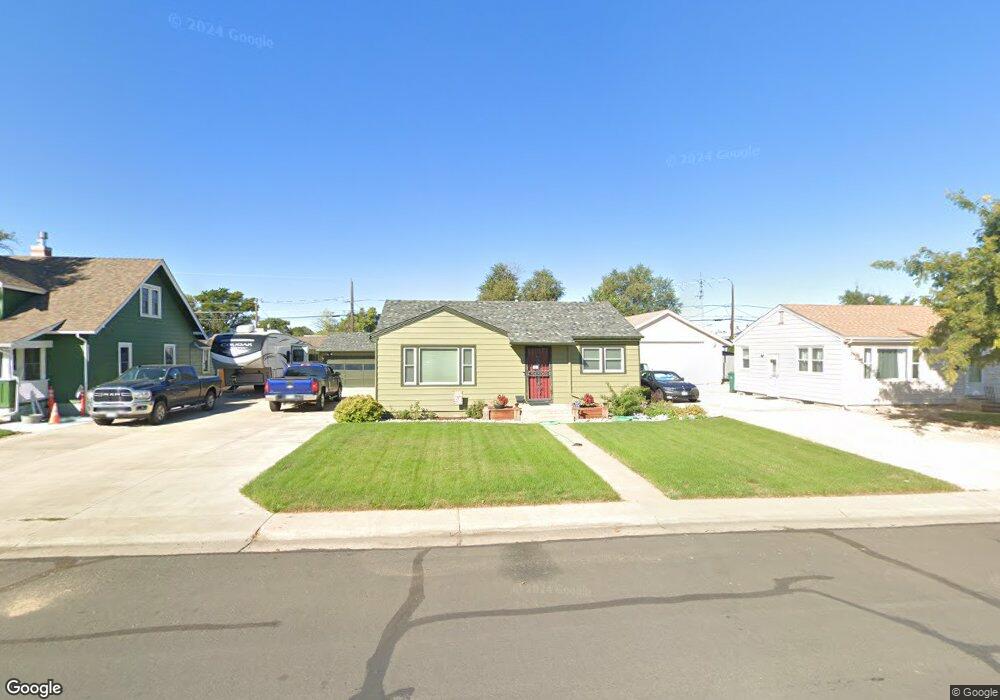
697 S 2nd Ave Brighton, CO 80601
Estimated Value: $388,000 - $440,000
3
Beds
2
Baths
1,704
Sq Ft
$242/Sq Ft
Est. Value
About This Home
This home is located at 697 S 2nd Ave, Brighton, CO 80601 and is currently estimated at $412,456, approximately $242 per square foot. 697 S 2nd Ave is a home located in Adams County with nearby schools including South Elementary School, Vikan Middle School, and Brighton High School.
Ownership History
Date
Name
Owned For
Owner Type
Purchase Details
Closed on
Aug 17, 2021
Sold by
Markley Mark V and Markley David A
Bought by
Ann & Jack Markley Legacy Llc
Current Estimated Value
Purchase Details
Closed on
Aug 2, 2021
Sold by
Markley David A and Estate Of Anna B Markley
Bought by
Markley Mark V and Markley David A
Purchase Details
Closed on
May 4, 2018
Sold by
Markley David A
Bought by
Padilla Peter Joseph
Home Financials for this Owner
Home Financials are based on the most recent Mortgage that was taken out on this home.
Original Mortgage
$291,127
Outstanding Balance
$250,901
Interest Rate
4.44%
Mortgage Type
VA
Estimated Equity
$161,555
Create a Home Valuation Report for This Property
The Home Valuation Report is an in-depth analysis detailing your home's value as well as a comparison with similar homes in the area
Home Values in the Area
Average Home Value in this Area
Purchase History
| Date | Buyer | Sale Price | Title Company |
|---|---|---|---|
| Ann & Jack Markley Legacy Llc | -- | None Available | |
| Markley Mark V | -- | None Available | |
| Padilla Peter Joseph | $285,000 | Stewart Title |
Source: Public Records
Mortgage History
| Date | Status | Borrower | Loan Amount |
|---|---|---|---|
| Open | Padilla Peter Joseph | $291,127 |
Source: Public Records
Tax History Compared to Growth
Tax History
| Year | Tax Paid | Tax Assessment Tax Assessment Total Assessment is a certain percentage of the fair market value that is determined by local assessors to be the total taxable value of land and additions on the property. | Land | Improvement |
|---|---|---|---|---|
| 2024 | $2,581 | $23,620 | $5,310 | $18,310 |
| 2023 | $2,569 | $27,060 | $5,410 | $21,650 |
| 2022 | $2,326 | $21,180 | $4,930 | $16,250 |
| 2021 | $2,181 | $21,180 | $4,930 | $16,250 |
| 2020 | $1,941 | $19,650 | $4,860 | $14,790 |
| 2019 | $1,942 | $19,650 | $4,860 | $14,790 |
| 2018 | $756 | $14,840 | $4,750 | $10,090 |
| 2017 | $755 | $14,840 | $4,750 | $10,090 |
| 2016 | $449 | $9,050 | $2,390 | $6,660 |
| 2015 | $448 | $4,520 | $1,190 | $3,330 |
| 2014 | $478 | $4,910 | $960 | $3,950 |
Source: Public Records
Map
Nearby Homes