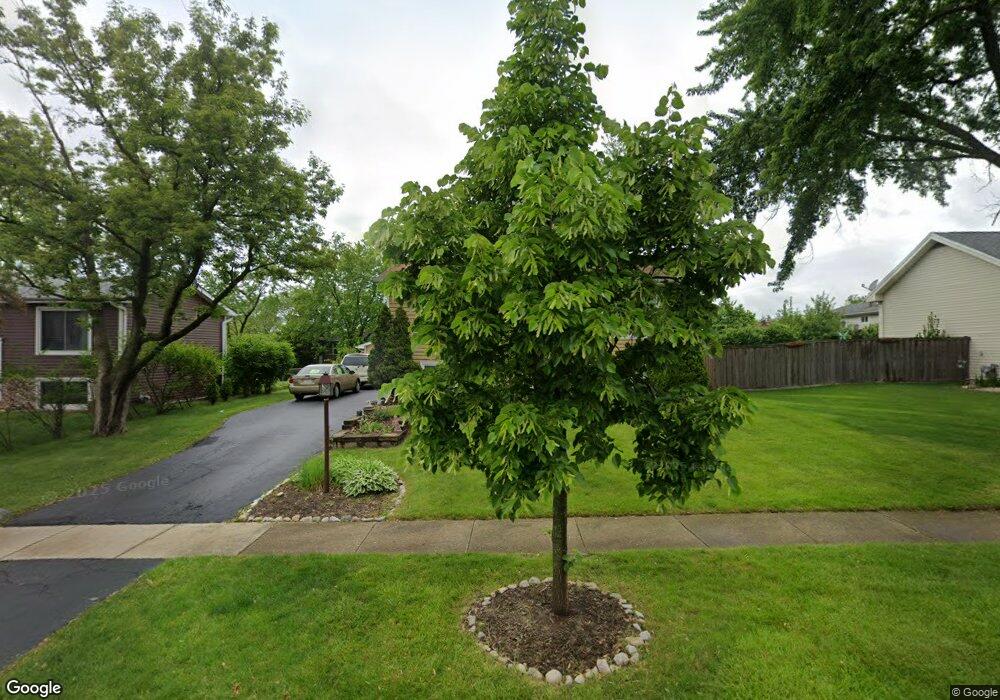
6970 Hemlock St Hanover Park, IL 60133
Estimated Value: $286,181 - $348,000
3
Beds
2
Baths
1,200
Sq Ft
$258/Sq Ft
Est. Value
About This Home
This home is located at 6970 Hemlock St, Hanover Park, IL 60133 and is currently estimated at $309,045, approximately $257 per square foot. 6970 Hemlock St is a home located in Cook County with nearby schools including Ontarioville Elementary School, Tefft Middle School, and Bartlett High School.
Ownership History
Date
Name
Owned For
Owner Type
Purchase Details
Closed on
Jul 30, 2002
Sold by
Medina Luis M
Bought by
Medina Jose
Current Estimated Value
Purchase Details
Closed on
Oct 26, 2000
Sold by
Rusin Dennis
Bought by
Medina Jose and Medina Luis M
Home Financials for this Owner
Home Financials are based on the most recent Mortgage that was taken out on this home.
Original Mortgage
$157,600
Outstanding Balance
$57,990
Interest Rate
7.86%
Mortgage Type
FHA
Estimated Equity
$251,055
Purchase Details
Closed on
Feb 9, 2000
Sold by
Hud
Bought by
Rusin Dennis
Purchase Details
Closed on
Mar 6, 1997
Sold by
Hardin Marcia and Cravens Lillian
Bought by
Monico Juan and Monico Irma
Home Financials for this Owner
Home Financials are based on the most recent Mortgage that was taken out on this home.
Original Mortgage
$114,213
Interest Rate
7.93%
Mortgage Type
FHA
Create a Home Valuation Report for This Property
The Home Valuation Report is an in-depth analysis detailing your home's value as well as a comparison with similar homes in the area
Home Values in the Area
Average Home Value in this Area
Purchase History
| Date | Buyer | Sale Price | Title Company |
|---|---|---|---|
| Medina Jose | -- | -- | |
| Medina Jose | $159,000 | -- | |
| Rusin Dennis | -- | -- | |
| Monico Juan | $115,000 | -- |
Source: Public Records
Mortgage History
| Date | Status | Borrower | Loan Amount |
|---|---|---|---|
| Open | Medina Jose | $157,600 | |
| Previous Owner | Monico Juan | $114,213 |
Source: Public Records
Tax History Compared to Growth
Tax History
| Year | Tax Paid | Tax Assessment Tax Assessment Total Assessment is a certain percentage of the fair market value that is determined by local assessors to be the total taxable value of land and additions on the property. | Land | Improvement |
|---|---|---|---|---|
| 2024 | $5,925 | $22,000 | $3,894 | $18,106 |
| 2023 | $5,739 | $22,000 | $3,894 | $18,106 |
| 2022 | $5,739 | $22,000 | $3,894 | $18,106 |
| 2021 | $4,682 | $15,668 | $2,725 | $12,943 |
| 2020 | $4,730 | $15,668 | $2,725 | $12,943 |
| 2019 | $4,711 | $17,409 | $2,725 | $14,684 |
| 2018 | $3,318 | $12,253 | $2,336 | $9,917 |
| 2017 | $3,967 | $14,020 | $2,336 | $11,684 |
| 2016 | $4,046 | $14,020 | $2,336 | $11,684 |
| 2015 | $3,840 | $12,645 | $2,141 | $10,504 |
| 2014 | $3,785 | $12,645 | $2,141 | $10,504 |
| 2013 | $3,641 | $12,645 | $2,141 | $10,504 |
Source: Public Records
Map
Nearby Homes
- 6988 Plumtree Ln
- 128 Sycamore Ave
- 2110 Cherry Ave
- 804 Bussey Ct
- 719 Lacy Ave
- 6551 Center Ave
- 2040 Poplar Ave
- 819 Robinson Ave
- 1899 Redwood Ave
- 748 Sterling Ct Unit A1
- 905 Miller Ave
- 1516 Mckool Ave
- 178 Stephanie Ct Unit D
- 27W607 Devon Ave
- 105 N Chase Ave
- 511 Freeman Ave
- 7411 Astor Ave
- 121 Lucille Ct Unit A
- 110 N Chase Ave
- 6830 Appletree St
- 6956 Hemlock St
- 6988 Hemlock St
- 2377 Sycamore Ave
- 6971 Chestnut St
- 6946 Hemlock St
- 6957 Chestnut St
- 6989 Chestnut St
- 6947 Chestnut St
- 6977 Hemlock St
- 6934 Hemlock St
- 6955 Hemlock St
- 2331 Sycamore Ave
- 6935 Chestnut St
- 6945 Hemlock St
- 6924 Hemlock St
- 7000 Hemlock St
- 2376 Sycamore Ave
- 6925 Chestnut St
- 6933 Hemlock St
- 6966 Hickory St