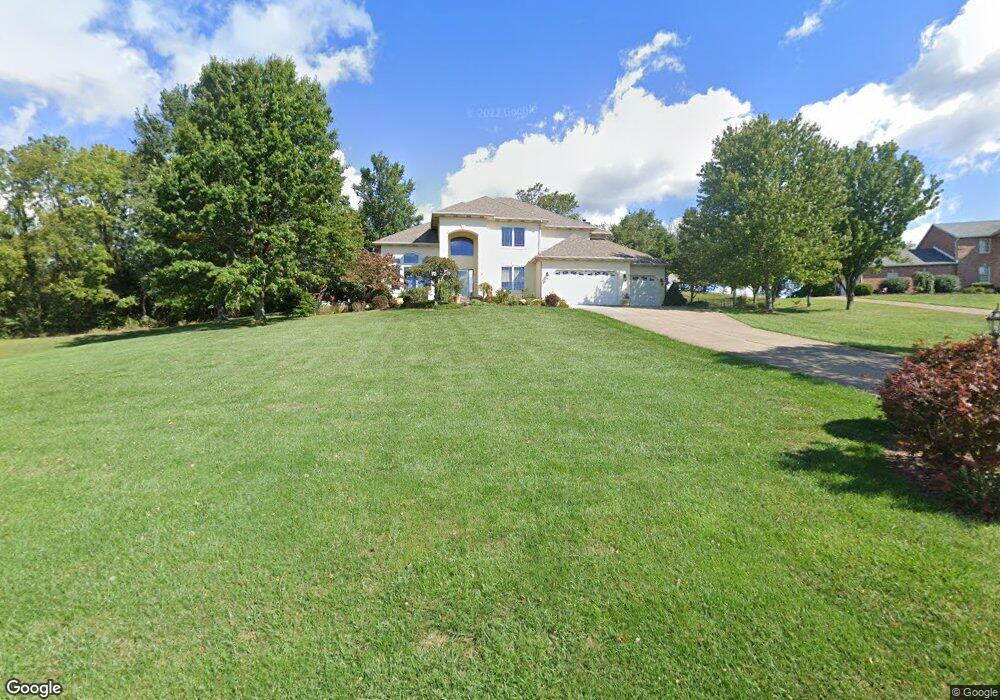
69717 Crestview Ln Saint Clairsville, OH 43950
Estimated Value: $633,000 - $976,000
4
Beds
4
Baths
3,128
Sq Ft
$233/Sq Ft
Est. Value
About This Home
This home is located at 69717 Crestview Ln, Saint Clairsville, OH 43950 and is currently estimated at $729,117, approximately $233 per square foot. 69717 Crestview Ln is a home located in Belmont County with nearby schools including St. Clairsville Elementary School, St. Clairsville Middle School, and St. Clairsville High School.
Ownership History
Date
Name
Owned For
Owner Type
Purchase Details
Closed on
Apr 1, 2025
Sold by
Forrelli Revocable Living Trust and Forrelli John R
Bought by
Gasber Joshua A
Current Estimated Value
Home Financials for this Owner
Home Financials are based on the most recent Mortgage that was taken out on this home.
Original Mortgage
$520,000
Outstanding Balance
$511,000
Interest Rate
6.04%
Mortgage Type
New Conventional
Estimated Equity
$218,117
Purchase Details
Closed on
Apr 20, 2020
Sold by
Forrelli John R and Forrelli Susan Lee
Bought by
Forrelli John R and Forrelli Susan L
Purchase Details
Closed on
Jun 29, 1992
Sold by
Forrelli John R and Forrelli Susan L
Bought by
Forrelli John R and Forrelli Susan L
Purchase Details
Closed on
Jan 1, 1986
Bought by
Clairmont Development Inc
Create a Home Valuation Report for This Property
The Home Valuation Report is an in-depth analysis detailing your home's value as well as a comparison with similar homes in the area
Home Values in the Area
Average Home Value in this Area
Purchase History
| Date | Buyer | Sale Price | Title Company |
|---|---|---|---|
| Gasber Joshua A | $866,666 | None Listed On Document | |
| Gasber Joshua A | $866,666 | None Listed On Document | |
| Forrelli John R | -- | None Available | |
| Forrelli John R | $20,000 | -- | |
| Clairmont Development Inc | -- | -- |
Source: Public Records
Mortgage History
| Date | Status | Borrower | Loan Amount |
|---|---|---|---|
| Open | Gasber Joshua A | $520,000 | |
| Closed | Gasber Joshua A | $520,000 |
Source: Public Records
Tax History Compared to Growth
Tax History
| Year | Tax Paid | Tax Assessment Tax Assessment Total Assessment is a certain percentage of the fair market value that is determined by local assessors to be the total taxable value of land and additions on the property. | Land | Improvement |
|---|---|---|---|---|
| 2024 | $6,889 | $197,530 | $14,700 | $182,830 |
| 2023 | $5,450 | $148,380 | $14,090 | $134,290 |
| 2022 | $5,021 | $148,380 | $14,088 | $134,292 |
| 2021 | $4,995 | $148,380 | $14,088 | $134,292 |
| 2020 | $4,577 | $129,030 | $12,250 | $116,780 |
| 2019 | $4,459 | $129,030 | $12,250 | $116,780 |
| 2018 | $4,448 | $129,030 | $12,250 | $116,780 |
| 2017 | $4,069 | $112,700 | $17,520 | $95,180 |
| 2016 | $4,016 | $112,700 | $17,520 | $95,180 |
| 2015 | $4,004 | $112,700 | $17,520 | $95,180 |
| 2014 | $4,125 | $111,110 | $15,930 | $95,180 |
| 2013 | $4,083 | $111,110 | $15,930 | $95,180 |
Source: Public Records
Map
Nearby Homes
- 0 Oldefield Dr Unit 5090766
- 0 Oldefield Dr Unit 5090764
- 0 Oldefield Dr Unit 5090613
- 0 Oldefield Dr Unit 5090609
- 0 Oldefield Dr Unit 5090603
- 0 Oldefield Dr Unit 5090600
- 131 Crisswill Dr
- 109 Willinda Dr
- 103 Park Dr
- 100 Pinecrest Dr
- 50023 Lin Chris Dr
- 101 Cresent St
- 112 Parshall Ave
- 48837 Hillcrest Dr
- 0 Barton Rd Unit 5154803
- 105 Franklin St
- 0 Hemingway (Inlot 3) Dr
- 261 E Main St
- 0 Walnut Ave Unit 5154929
- 0 Hemingway (Inlot 9) Dr Unit 5109276
- 69713 Crestview Ln
- 69733 Crestview Ln
- 69709 Crestview Ln
- 69722 Crestview Ln
- 69701 Crestview Ln
- 69696 Crestview Ln
- 49470 Oldefield Dr
- 69699 Crestview Ln
- 69682 Crestview Ln
- 69753 Crestview Ln
- 69755 Crestview Ln
- 49460 Oldefield Dr
- 69681 Crestview Ln
- 69767 Crestview Ln
- 69670 Crestview Ln
- 69781 Crestview Ln
- 69637 Crestview Ln
- 49475 Northpointe Ln
- 69787 Crestview Ln
- 69948 The Meadows