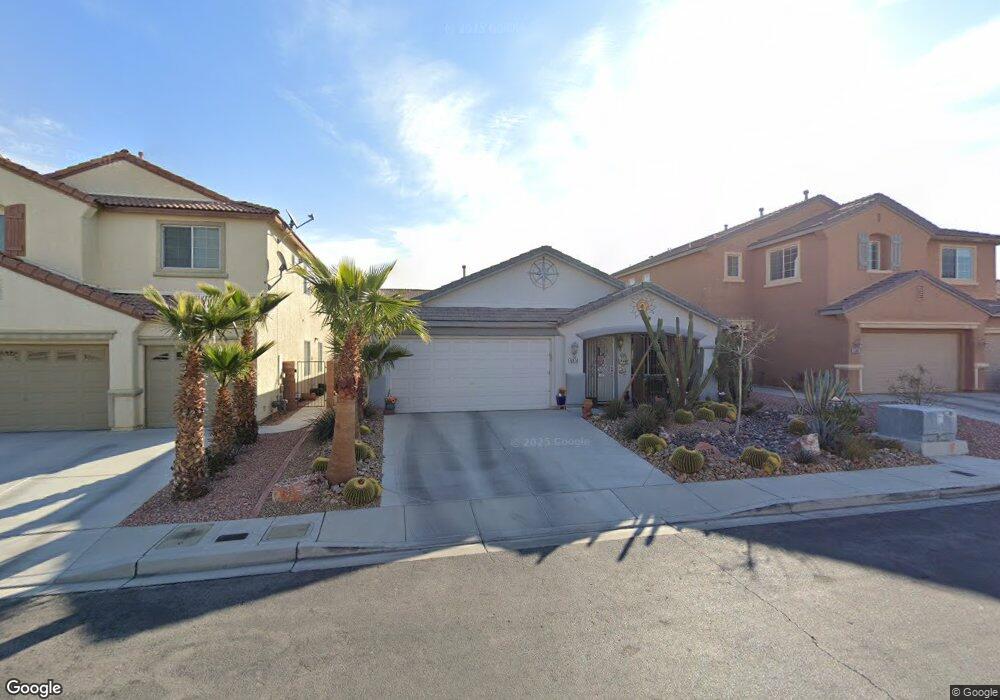
6974 Flowering Willow St Las Vegas, NV 89148
Estimated Value: $445,440 - $462,000
2
Beds
2
Baths
1,749
Sq Ft
$259/Sq Ft
Est. Value
About This Home
This home is located at 6974 Flowering Willow St, Las Vegas, NV 89148 and is currently estimated at $453,860, approximately $259 per square foot. 6974 Flowering Willow St is a home located in Clark County with nearby schools including Wayne N. Tanaka Elementary School, Wilbur & Theresa Faiss Middle School, and Sierra Vista High School.
Ownership History
Date
Name
Owned For
Owner Type
Purchase Details
Closed on
Sep 29, 2022
Sold by
Locicero Laurence
Bought by
Lucero Joshua Anthony
Current Estimated Value
Purchase Details
Closed on
Sep 23, 2022
Sold by
Laurence Locicero
Bought by
Locicero Laurence and Locicero Richard Allan
Purchase Details
Closed on
Oct 21, 2013
Sold by
Locicero Lucille and Locicero Laurence
Bought by
Locicero Lucille and Locicero Laurence
Purchase Details
Closed on
Jul 7, 2008
Sold by
Sainz Gloria
Bought by
Locicero Lucille and Locicero Laurence
Purchase Details
Closed on
Oct 17, 2002
Sold by
U S Home Corp
Bought by
Sainz Gloria
Home Financials for this Owner
Home Financials are based on the most recent Mortgage that was taken out on this home.
Original Mortgage
$170,628
Interest Rate
6.05%
Create a Home Valuation Report for This Property
The Home Valuation Report is an in-depth analysis detailing your home's value as well as a comparison with similar homes in the area
Home Values in the Area
Average Home Value in this Area
Purchase History
| Date | Buyer | Sale Price | Title Company |
|---|---|---|---|
| Lucero Joshua Anthony | -- | -- | |
| Locicero Laurence | $261,994 | -- | |
| Locicero Lucille | -- | None Available | |
| Locicero Lucille | $255,000 | Chicago Title The Pointe | |
| Sainz Gloria | $212,835 | Stewart Title |
Source: Public Records
Mortgage History
| Date | Status | Borrower | Loan Amount |
|---|---|---|---|
| Previous Owner | Sainz Gloria | $170,628 |
Source: Public Records
Tax History Compared to Growth
Tax History
| Year | Tax Paid | Tax Assessment Tax Assessment Total Assessment is a certain percentage of the fair market value that is determined by local assessors to be the total taxable value of land and additions on the property. | Land | Improvement |
|---|---|---|---|---|
| 2025 | $2,635 | $112,381 | $38,500 | $73,881 |
| 2024 | $2,230 | $112,381 | $38,500 | $73,881 |
| 2023 | $2,230 | $103,063 | $33,250 | $69,813 |
| 2022 | $2,065 | $91,698 | $28,000 | $63,698 |
| 2021 | $1,912 | $85,077 | $24,500 | $60,577 |
| 2020 | $1,773 | $83,445 | $23,450 | $59,995 |
| 2019 | $1,661 | $80,086 | $21,000 | $59,086 |
| 2018 | $1,585 | $73,270 | $16,450 | $56,820 |
| 2017 | $2,149 | $73,276 | $15,750 | $57,526 |
| 2016 | $1,485 | $65,835 | $11,900 | $53,935 |
| 2015 | $1,481 | $57,177 | $10,850 | $46,327 |
| 2014 | $1,435 | $47,467 | $6,300 | $41,167 |
Source: Public Records
Map
Nearby Homes
- 9330 W Maule Ave Unit 226
- 9330 W Maule Ave Unit 212
- 6867 Dragonfly Rock St
- 6861 Dragonfly Rock St
- 6837 Dragonfly Rock St
- 7011 Azure Beach St
- 0 Fort Apache Unit 2719841
- 6770 Firewood Dr
- 6788 Rose Mallow St Unit 3
- 6768 Pastel Camellia St
- 9186 Berstler Ave Unit 1A
- 6739 Twisted Wood Dr
- 9557 Belmont Bay Ave
- 9225 Broome Ct
- 9299 Adamshurst Ave
- 9219 Broome Ct
- 9249 Shellmont Ct
- 9213 Broome Ct
- 6884 Stonetrace St
- 9544 Wild Valley Ave
- 6966 Flowering Willow St
- 6982 Flowering Willow St
- 6958 Flowering Willow St
- 6990 Flowering Willow St
- 6969 Silk Oak Ct
- 6977 Silk Oak Ct
- 6961 Silk Oak Ct
- 6985 Silk Oak Ct
- 6996 Flowering Willow St
- 6950 Flowering Willow St
- 6953 Silk Oak Ct
- 6975 Flowering Willow St
- 6967 Flowering Willow St
- 6983 Flowering Willow St
- 6983 Flowering Willow St Unit hse
- 6959 Flowering Willow St
- 6945 Silk Oak Ct
- 7002 Flowering Willow St Unit None
- 7002 Flowering Willow St
- 6942 Flowering Willow St