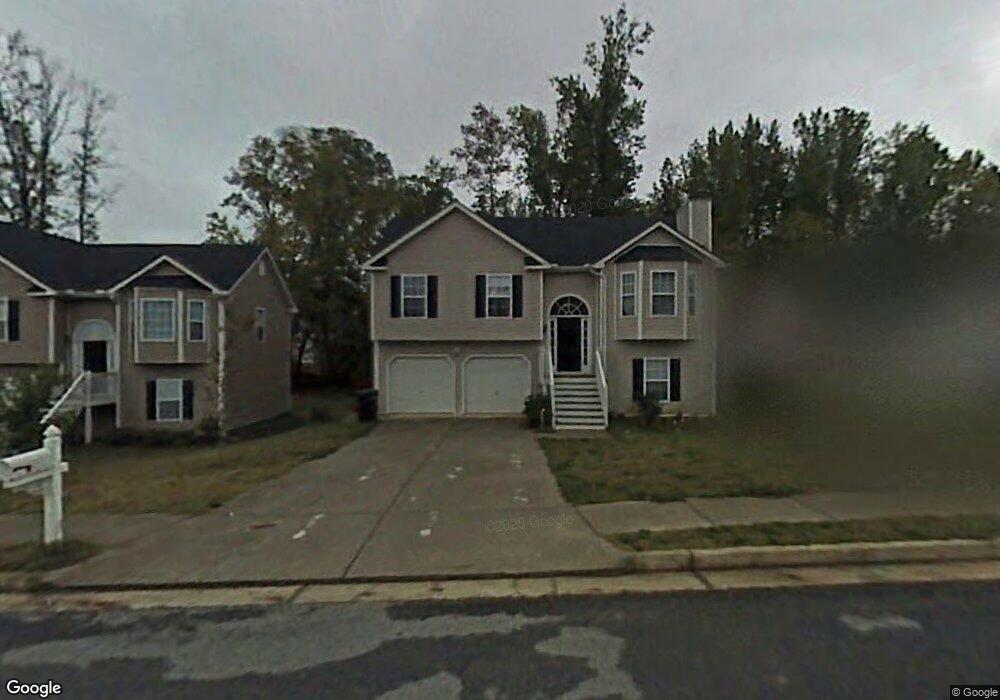
6975 Pine Shadow Way Winston, GA 30187
Estimated Value: $237,000 - $255,061
4
Beds
3
Baths
1,188
Sq Ft
$208/Sq Ft
Est. Value
About This Home
This home is located at 6975 Pine Shadow Way, Winston, GA 30187 and is currently estimated at $247,515, approximately $208 per square foot. 6975 Pine Shadow Way is a home located in Douglas County with nearby schools including Bright Star Elementary School, Mason Creek Middle School, and Douglas County High School.
Ownership History
Date
Name
Owned For
Owner Type
Purchase Details
Closed on
May 23, 2008
Sold by
Federal National Mortgage Association
Bought by
Whatley David and Whatley Shyvonne
Current Estimated Value
Home Financials for this Owner
Home Financials are based on the most recent Mortgage that was taken out on this home.
Original Mortgage
$123,673
Outstanding Balance
$76,481
Interest Rate
5.86%
Mortgage Type
FHA
Estimated Equity
$171,034
Purchase Details
Closed on
Dec 4, 2007
Sold by
Greenpoint Mortgage Funding
Bought by
Federal National Mortgage Association
Purchase Details
Closed on
Feb 26, 2004
Sold by
Kirkwood Homes Inc
Bought by
Gilroy Keith and Cruz Angel
Home Financials for this Owner
Home Financials are based on the most recent Mortgage that was taken out on this home.
Original Mortgage
$115,200
Interest Rate
5.53%
Mortgage Type
New Conventional
Create a Home Valuation Report for This Property
The Home Valuation Report is an in-depth analysis detailing your home's value as well as a comparison with similar homes in the area
Home Values in the Area
Average Home Value in this Area
Purchase History
| Date | Buyer | Sale Price | Title Company |
|---|---|---|---|
| Whatley David | -- | -- | |
| Federal National Mortgage Association | -- | -- | |
| Greenpoint Mortgage Funding | $122,074 | -- | |
| Gilroy Keith | $144,000 | -- |
Source: Public Records
Mortgage History
| Date | Status | Borrower | Loan Amount |
|---|---|---|---|
| Open | Whatley David | $123,673 | |
| Previous Owner | Gilroy Keith | $115,200 |
Source: Public Records
Tax History
| Year | Tax Paid | Tax Assessment Tax Assessment Total Assessment is a certain percentage of the fair market value that is determined by local assessors to be the total taxable value of land and additions on the property. | Land | Improvement |
|---|---|---|---|---|
| 2025 | $2,527 | $68,920 | $11,200 | $57,720 |
| 2024 | $2,534 | $68,920 | $11,200 | $57,720 |
| 2023 | $2,534 | $68,920 | $11,200 | $57,720 |
| 2022 | $2,452 | $68,920 | $11,200 | $57,720 |
| 2021 | $2,035 | $53,720 | $10,640 | $43,080 |
| 2020 | $2,076 | $53,720 | $10,640 | $43,080 |
| 2019 | $1,930 | $52,040 | $10,640 | $41,400 |
| 2018 | $1,658 | $44,440 | $9,280 | $35,160 |
| 2017 | $1,503 | $40,200 | $9,280 | $30,920 |
| 2016 | $1,557 | $40,880 | $9,720 | $31,160 |
| 2015 | $1,145 | $35,160 | $8,400 | $26,760 |
| 2014 | $1,145 | $30,640 | $7,920 | $22,720 |
| 2013 | -- | $28,480 | $7,360 | $21,120 |
Source: Public Records
Map
Nearby Homes
- 2960 Rolling Ln Unit 1
- 6995 Pine Shadow Way
- 2940 Rolling Ln
- 6074 Locklear Way
- 6054 Locklear Way
- 6854 John West Rd
- 2575 Hamrick Rd
- 6022 Southbend Ct
- 2840 Ward Dr
- 2914 Vogue Dr
- 2903 Vogue Dr
- 3127 Bright Star Rd
- 3096 Campground Rd
- 6390 Executive Dr
- 6662 Birchwood Ct
- 6431 Courtney Dr
- 6865 Cowan Mill Rd
- 3677 Bright Star Rd
- 3706 Sherwood Dr
- 6155 Pointer Way
- 6973 Pine Shadow Way
- 6977 Pine Shadow Way
- 6979 Pine Shadow Way
- 2973 Rolling Ln
- 2971 Rolling Ln
- 6971 Pine Shadow Way
- 2975 Rolling Ln Unit 1
- 2969 Rolling Ln
- 0 Rolling Ln Unit 7521737
- 6981 Pine Shadow Way
- 6972 Pine Shadow Way
- 6976 Pine Shadow Way
- 6974 Pine Shadow Way
- 6976 Pine Shadow Way
- 6976 Pine Shadows
- 6976 Pine Shadow Way
- 2967 Rolling Ln
- 2977 Rolling Ln
- 6980 Pine Shadow Way
- 6980 Pine Shadow Way
Your Personal Tour Guide
Ask me questions while you tour the home.